Saturday, December 23, 2023

Keep right

 A few days ago, the New York Times published an opinion piece  by Matthew Schmitz which said that Donald Trump "isn’t edging ahead of Mr. Biden in swing states because Americans are eager to submit to authoritarianism.  . . . Mr. Trump enjoys enduring support because he is perceived by many voters — often with good reason — as a pragmatic if unpredictable kind of moderate."  This was once true-- September 2016, a survey found that only 47% thought that Trump was a conservative, compared to about 60% for Mitt Romney in 2012 and John McCain in 2008.  But a lot has happened since 2016--is it still true?  In November 2023, a survey sponsored by Marquette Law School found that 78% thought Trump was conservative.  That is, perceptions are very different today than they were in 2016.   Comparing Trump with some Republican presidents and candidates from the past:

                                    VL    SL    M     SC  VC   DK   mean

Reagan 04/1980           5 15 33 30 7 10 0.21
Reagan 01/1981         2 7 15 38 24 15 0.87
Reagan 01/1983    4 7 16 28 28 16 0.83
Reagan 02/1984     4 10 31 26 19 10 0.51
Bush 06/1999         2 12 27 31 9 19 0.41
Bush 01/2000      3 11 19 38 10 19 0.51
Bush 03/2000         6 13 22 31 17 11 0.45
Bush 10/2000         5 10 18 39 20 8 0.64
Bush 11/2003         6 9 19 39 22 5 0.65
Bush 07/2004         2 6 19 43 24 5 0.86
McCain 12/2007         2 8 32 39 6 12 0.45
Romney 12/2007         1 8 22 39 8 21 0.58
McCain 01/2008         2 10 27 35 7 19 0.43
McCain 03/2008         4 7 31 29 17 12 0.55
McCain 06/2008         2 8 34 29 19 8 0.60
McCain 10/2008         2 8 26 45 17 3 0.68
Romney 12/2011         2 9 53 22 7 7 0.25
Romney 10/2012         5 9 21 40 16 9 0.58
Romney 11/2012         4 5 26 37 19 9 0.68
Trump 09/2016         8 12 21 30 17 13 0.41
Trump 07/2022         6 4 11 30 48 1 1.11
Trump 11/2023         7 3 13 30 48 0 1.08

Unfortunately, the question doesn't seem to have been asked between 2016 and 2022, so we can't say just when perceptions changed, but they have definitely changed--Trump is now seen as more conservative than GW Bush, Romney, or even Reagan ever was.  This isn't surprising, because he governed as a conservative Republican (as Alan Abramowitz, a professor of Political Science at Emory University, pointed out in a letter to the editor today).  As far as why Trump leads Biden in most recent polls, a more likely explanation is the tradition of the two-party system--if people don't think Biden is doing a good job, they turn to the Republicans.  And Republican elites haven't made an effort to discredit Trump or push him aside, so ordinary voters treat him as a normal representative of the party.  

[Data from the Roper Center for Public Opinion Research]


Thursday, December 21, 2023

Not what it seems

 A day or two ago, a column by Bret Stephens said a Harvard/Harris poll  "finds that 44 percent of Americans ages 25 to 34, and a whopping 67 percent of those ages 18 to 24, agree with the proposition that 'Jews as a class are oppressors.' . . . . The same generation that received the most instruction in the virtues of tolerance is now the most antisemitic in recent memory."  I've seen several other references to that poll since then.  The full question is "Do you think that Jews as a class are oppressors and should be treated as oppressors or is that a false ideology?"  Some people have observed that other recent surveys suggest much lower levels of anti-Semitism.  But then how do you explain the Harvard/Harris results?  I think that the key is in a question that comes just before "There is an ideology that white people are oppressors and nonwhite people and people of certain groups have been oppressed and as a result should be favored today at universities and for employment. Do you support or oppose this ideology?"    That's followed by a question on "Do you think this ideology is helpful or hurtful to our society?" and then the question about whether Jews are oppressors.  Comparing the percent agreeing that white people and Jews are oppressors by age:

              Whites           Jews

18-24      79%              67%
25-34      49%              44%
35-44      39%              36%
45-54      33%              24%
55-64      26%              15%
65+         19%                9%

Support for the statement that Jews are oppressors is consistently a little lower than support for the statement that white people are oppressors.  So the most plausible interpretation of the results for that question is that most people who agreed that white people are oppressors regard Jews as white people rather than "nonwhite people and people of certain groups."  In any case, if you accept the results for the question on Jews as evidence of widespread anti-Semitism among young people, you have to accept the results for the previous question as evidence of even more widespread "anti-whitism."  My interpretation of the results on the first question is that people treated it as about general recognition of racial injustice and/or support for affirmative action, although it's so badly worded that it's hard to be sure.  

A couple of other points on the Harvard/Harris survey:
1.  The general direction of the age differences is reasonable, but they seem implausibly large for many questions.  I suspect there's something wrong with either their sample (an online panel) or their weighting.
2.  Many of the questions could serve as examples of things to avoid when writing survey questions.  

And on anti-Semitism:
1.  I think that, like other kinds of ethnic and religious prejudice, it is declining, and there's less of it in younger generations.
2.  However, more than other kinds of prejudice, anti-Semitism tends to be elaborated into a comprehensive world-view.  That makes it more harmful than the numbers alone would suggest.
3.  There is an anti-Semitism of the left.  People on the left used to be aware of this--"anti-Semitism is the socialism of fools" was a well-known expression in the early days of the German Social Democratic Party--but I think that recognition has faded, and leftists now often assume that anti-Semitism just involves people like Richard Spencer and isn't something they need to look out for on their side.  

Sunday, December 17, 2023

And the echo answered "fraud!"

 I have an account on Truth Social, and I check it from time to time to see what Donald Trump is saying.  He recently posted a story from Breitbart about a survey by Rasmussen Reports.  According to the story "more than 1-in-5 voters who submitted ballots by mail say they did so fraudulently."  This isn't just some Twitter "poll"--Rasmussen has decent record of accuracy in predicting elections (a B rating from 538)--so it deserves a closer look.  

The survey found the 30% of the sample said they voted by mail in the 2020 election.  Those who said they did were asked "did a friend or family member fill out your ballot, in part or in full, on your behalf" (19% yes); "did you fill out a ballot, in part or in full, on behalf of a friend or family member, such as a spouse or child?" (21% yes); "did you cast a mail-in ballot in a state where you were no longer a permanent resident? (17% yes); "did you sign a ballot or ballot envelope on behalf of a friend or family member, with or without his or her permission?" (17% yes).  Everyone was asked three additional questions whether "a friend, family member, or organization, such as a political party, offer to pay or reward you for voting?" (8% yes); whether "you know a friend, family member, co-worker, or other acquaintance who has admitted to you that he or she cast a mail-in ballot in 2020 in a state other than his or her state of permanent residence?" (10% yes); and whether "you know a friend, family member, co-worker, or other acquaintance who has admitted to you that he or she filled out a ballot on behalf of another person?" (11% yes).  

Rasmussen didn't release the original data, but they provided a detailed breakdown of responses.  In looking at that, I noticed something strange--people who said they voted for Trump were likely to say that they had done these things.  For example, among people who voted by mail, 26% of Trump voters and 14% of Biden voters said that a friend or family member had filled in their ballot.  A larger fraction of Biden voters voted by mail (36% vs. 23%), so overall, .23*.26=.060 or 6% of Trump voters and .36*.13=.050 or 5% of Biden voters said that someone else had filled in their ballot.  The total percent of voters who answered yes on each question:

                                                                   Trump                Biden

Someone else filled in your ballot                  6.0%                5.0%
You filled out someone else's                         6.9%                4.7%
Signed someone else's                                    5.3%                4.0%

So if you accept the data, Trump voters were more likely to engage in "fraud" than Biden voters.

 For the questions asked of everyone:

Offer of reward                                               6%                    9%
Know out-of-state voter                                13%                    8%
Know someone who filled out other's           12%                    9%

There was also another odd pattern in the data.  For all of the questions, people in the youngest age group (18-39) were more likely to answer yes--a lot more likely.  For example, 33% of people aged 18-39, 9% of people aged 40-64, and 1% of people aged 65% said that they had signed someone else's ballot.  Of course, there is sampling error, but these aren't tiny groups--there are roughly 100 absentee voters in each age group.  Since people in the youngest age group were more likely to have voted for Biden, the tendency for Trump voters to be more likely to report irregularities would be even stronger after controlling for age.   The age differences are also present in the questions asked of everyone--19% of 18-39 year olds, 7% of 40-64 year olds, and 3% of people over 65 said they knew someone who admitted casting a ballot in a state of which they weren't a resident.  

How can you explain the age differences? I doubt that there has been a dramatic increase in propensity to violate the rules for mail in ballots (and to tell friends, family members, and acquaintances that you've violated the rules) across the generations.  Rasmussen has a statement on their methodology that might provide an answer.  Their sample is mostly obtained by random-digit dialing of phone numbers, but "to reach those who have abandoned traditional landline telephones, Rasmussen Reports uses an online survey tool to interview randomly selected participants from  a demographically diverse panel." Unlike most survey organizations, Rasmussen doesn't use live interviewers--there's a recorded voice and people answer by "press 1 for yes, 2 for no....."  I suspect that people are more likely to give a false answer with this format than when speaking to a person, and because Trump has been saying that there was fraud in mail voting, Trump voters may have wanted to help give evidence of fraud.**  This tendency is likely to be stronger in the panel--since they are regularly asked to do surveys (and probably are generally more online), they are likely to have a better sense of how the results will be used.  People without landlines tend to be young, so the panel probably makes up a much larger share of the 18-39 group.  So my hypothesis is that many of the "yes" answers are a result of Trump voters (especially in the panel) giving answers that they think will help to make Trump's case that there was a lot of fraud in the election.   Another factor is that people in the online panel are presumably given some compensation for participating in the surveys, so they may rush through without paying much attention.  Most organizations make some effort to identify people like this and remove them from the sample, but they are usually pretty crude and Rasmussen doesn't say anything about whether and how they do it.  So some of the "yes" answers, especially in the youngest cohort, may be people who are essentially answering at random.  


*The "no longer a permanent resident" question was left out of the table.  

**The question about who you voted for was asked before the questions on voting irregularities--that is, people answered it before they knew what the survey would be about.  

Tuesday, December 12, 2023

Do you know what I mean?

 There's been a lot of discussion of the evasive answers given by the presidents of Harvard, Penn, and MIT to a question on whether a call for genocide against the Jewish people would violate their institution's code of conduct.  But one point that has rarely been mentioned is that there's no evidence that anyone at those universities, or any other university, has called for genocide against the Jewish people.  The premise of the question was that certain slogans , like "from the river to the sea," are equivalent to calls for genocide.   

What do people who say "from the river to the sea" mean?  I think that the great majority would say they want a secular state encompassing what is now Israel, Gaza, and the West Bank in which Jews, Muslims, and people of other religions all are equal.  It's easy to see why this vision would be appealing, especially for Americans.  Of course, you could object that it's naive and unrealistic, but student politics (and let's face it, faculty politics too) often involves taking stands on principle with little regard to practicality.  

There is a poll that bears on this issue--it has a question on whether Israel should "remain a Jewish state," "become a mixed state in which Palestinians have a major share of power," or "should no longer exist as an independent country."  Unfortunately, it's from 2002, but it's the only one I could find that asks about general vision for the future.  Overall, 42% said Israel should remain a Jewish state, 39% that it should become a mixed state, 6% that it should no longer exist, and 14% didn't know.  Some factors that were related to opinions (from now on, the base for the percentages excludes don't knows):
1.  Religion--there were only 19 Jews in the sample, and all 19 said Israel should remain a Jewish state.  Among Protestants, 56% said it should remain a Jewish state, 37% that it should become a mixed state; Catholics favored a mixed state by 60%-34%.  People with no religion were in between.  
2.  Race--blacks were more likely to say Israel should not exist (18%-6%).  Support for a mixed state was highest among Hispanics (53%).
3.  Education--more educated people were more likely to say Israel should become a mixed state and less likely to say it should not exist, but the differences were not very big (50%-39%-11% among people without a high school degree, 47%-49%-5% among college graduates).  
4.   Age--younger people were more likely to say that Israel should become a mixed state--support for that option fell from 54% among people aged 18-29 to 31% among people aged 65 and above.  
5.  Party--Republicans were somewhat more likely to say Israel should remain a Jewish state, and Democrats more likely to favor the other two options.  But the highest support for a "mixed state" was among independents (57%, against 39% among both Democrats and Republicans).  Independents tend to have less political knowledge and interest, so I think this shows that the mixed position has an intuitive appeal.  

These results raise a question of why political elites pretend the "mixed" position doesn't exist rather than trying to explain why it wouldn't work.  Of course, part of the answer is just the search for political advantage--discrediting an opinion is often more appealing than engaging with it.  Another is that it's a fringe position among political elites, so they don't realize that it's fairly popular among the public.  And finally, there's the "anti-elitist" mood that I've remarked on before:  people who (rightly) say that we should try to understand working-class Trump voters rather than just condemning them as racist will go straight to condemning college students, especially Ivy Leaguers, as anti-Semitic.  

[Data from the Roper Center for Public Opinion Research]

Monday, December 4, 2023

Changing views of Israel?

In the last few months, strongly negative views of Israel have been more prominent than they have been in the past.  Does this reflect a change in general public opinion?  In 1956, 1966, and then frequently from the 1970s to the 1990s, there were questions asking people to rate Israel on a scale of -5 to +5.  Since the 1980s, there have been frequent questions asking if you have very favorable, somewhat favorable, somewhat unfavorable, or very unfavorable views of Israel.  The figure shows the percent holding strongly negative views--"very unfavorable" or  -4 and -5 on the -5 to +5 scale.  (I started from the present and worked backwards, so "Form 1" is the newer question and "Form 2" is the older one).


Over the long term, there is no trend.  Although there's a lot of short-term variation among surveys, it seems like there was an increase in the 1980s and then a decline in the 1990s, but since then it's been pretty steady (at least until the last survey in February 2023).  I don't recall the history well enough to offer an explanation for the change in the 1980s-90s.   

So the change in political discourse apparently doesn't reflect a change in the overall distribution of views.  But what about the social location of anti-Israel views?  The General Social Survey regularly asked the -5 to +5 question from the 1970s to the 1990s, so I got breakdowns by some demographic groups and compared them to the average from the last four Gallup surveys (2020-23)

                                            Strongly Unfavorable Views of Israel
                             
                                          1970s-90s                 2020s
White                                     10%                        5%                       
Non-white                             13%                        13%

18-34                                      11%                       10%
35-54                                        9%                         8%
55-64                                      12%                         6%

Republican                               9%                          5%
Independent                             10%                         9%
Democrat                                 11%                        10%

Conservative                              9%                          5%
Moderate                                  11%                          9%
Liberal                                      10%                         11%

College grad                               6%                           6%
Not college grad                        12%                          9%

The differences by race, age, party, and ideology were small in the GSS sample--strongly negative views of Israel were scattered about equally among all of those groups.  In recent years, however, there is a pattern--strongly negative views are more common among younger people, non-whites, liberals, and Democrats.  So they now have more of a definite social location.  But education is different--the gap has become smaller.  Despite the attention given to anti-Israel views in universities, particularly elite universities, strongly negative views of Israel remain more common among less educated people.  How do you reconcile this with the apparent strength of anti-Israel views at universities, especially elite universities?  It's possible that there's an interaction involving education and age--that anti-Israel views are common among  college students or young college graduates.  I can't check this, since I don't have access to the individual-level data for recent surveys, but I don't think that it's likely to be more than a secondary factor.  I think this is a case where advocates of a minority view are unwilling to or don't feel the need to moderate their demands in order to appeal to the majority.  This is somewhat unusual, but not remarkably so--for example, you also see it with abortion (on both sides), and the Freedom Caucus approach to government spending.  I don't know of any attempts to explain when and why it happens, although it seems like an important issue.   

[Data from the Roper Center for Public Opinion Research]


Wednesday, November 29, 2023

Judgment and opinion

 Exactly a year ago, I had a post about a survey question from 1993 on whether members of Congress should follow public opinion or their own judgment when voting on issues.  I wasn't planning on marking the anniversary, but by coincidence I recently ran across other questions on the same issue, from 1939 and 1940.  They aren't identical to the 1993 question, but seem similar enough to be compared.  The overall distributions:

            Own       Public     

1939     38            59          A
1940     32            64          A
1940     35            39          B
1993     23            70          C

The exact questions:
A.  Should members of Congress vote according to their own best judgment or according to the way the people in their districts feel?
B.  In cases when a Congressman's opinion is different from that of the majority of people in his district, do you think he should usually vote according to his own best judgment, or according to the way a majority of his district feels?
C.  When your representative in Congress votes on an issue, which should be more important:  the way that voters in your district feel about the issue, or the Representative's own principles and judgment about what is best for the country?

The percent choosing the "own judgment" option is substantially lower in the 1993 question than in all three of the 1939-40 questions. It seems to me that the addition of  "what is best for the country" in the 1993 question made the "own judgment" side sound more favorable, so if the differences in question wording mattered they probably understated the change.  In looking at the 1993 question, I had found that education didn't make much difference.  The 1939 and 1940 surveys didn't ask about education, but they had variables for occupation and interviewer's rating of social standing.  People of "higher" position were a bit more likely to say that representatives should follow their own judgement, but it was only a small difference.  I tried a few other demographic variables, which didn't make much difference.  So the major story is simply the difference in the overall distributions.  Of course, 1993 was 30 years ago, so we don't know what's happened since then.   It seems strange that no one has asked about the issue since then, so I'll make another attempt to find questions.

The 1939 survey also asked about a question I've written about before "Do people who are successful get ahead largely because of their luck or largely because of their ability?"  The same question was also asked in 1970 and then in 2016.  My previous post on this question reported the distribution (16% said luck in 1939, 8% in 1970, and 13% in 2016), but didn't look at group differences.  In 1939, there were large differences by economic standing:  

                                       Luck     Ability
Wealthy                           3%          97%
Average +                       7%           93%
Average                         11%          89%
Poor+                             17%          83%
Poor                                23%         77%
On relief                         30%         70%

Unfortunately, the individual data for the 2016 survey is not available in the Roper Center or ICPSR--I will try to track it down, although I think the odds are against me.

[Data from the Roper Center for Public Opinion Research]

Saturday, November 18, 2023

It's all over now?, part 2

 I wasn't going to have another post on this topic, but then I read an article in the New York Times that drew parallels between Biden's position today and Obama's and George W. Bush's positions when they were running for re-election.  It suggested that discouraging early polls had led Obama and Bush to "retool" and "recast" their campaigns.  But the figures in my last post shows that both led in the polls at the corresponding point in the campaign, and that their performance in the election was very close to what would have been predicted from the polls a year before.  Of course, this doesn't mean that the campaign efforts didn't matter--holding onto a narrow lead is an accomplishment, but it's a different accomplishment from "turning around a struggling campaign."

The story contrasted GW Bush and Obama to "George H.W. Bush in 1992, [who] failed to heed polls showing voters distressed about the economy and ready for a change after 12 years of Republicans in the White House."  I hadn't included that race in my post because there were no surveys about Bush vs. Clinton in November 1991.  But there were surveys in October and December, and then more starting in January 1992.   In the October 1991 survey, Bush had a big lead:  58% said they would vote for Bush and 22% for Clinton.  Bush's lead in the surveys through early April 1992:

His lead diminished pretty steadily, with maybe an upturn in late March, but he was consistently ahead:  out of 25 surveys, 24 had Bush in the lead, and one had them tied.  So the early polls weren't showing warning signs.  

I had forgotten that Bush was far ahead for so much of the campaign, and not just against Clinton--he led by similar margins in matchups with other potential Democratic candidates.  I remembered that he had been very popular after the end of the Gulf War, but thought that faded pretty quickly and that the presidential race was competitive from the beginning.  It looks like the New York Times writers made the same mistake.  

The growth of partisan polarization means that a swing of this size couldn't happen today.  But the 1992 election may be relevant in  another way.  Going by basic economic statistics, things weren't great, but weren't that bad either, but popular perceptions of the economy were very negative.    As far as I know, there's no generally accepted explanation for the gap.  Either the Bush campaign didn't make enough effort to turn the perceptions around, or their efforts weren't successful.  Either way, the experience may have some lessons for today.

[Data from the Roper Center for Public Opinion Research]


Tuesday, November 14, 2023

It's all over now?

Donald Trump has generally been leading Joe Biden in recent polls of how you would vote if an election were held today.  How much does this tell us about their prospects for the actual election?  Questions about how you would vote in a hypothetical election go back to the early days of survey research, so we have a pretty long historical record to go on.  I collected questions from the November one year before the election that involved the eventual nominees.  I found them for most elections starting in 1944.  In 1952, 1968, 1976, 1988, and 1992, there were no surveys that asked about the actual matchup.  I also excluded 1972, when all surveys that asked about Nixon and McGovern also included George Wallace as a third party candidate, and 1964, when a survey taken just a few days after the Kennedy assassination showed Johnson with a 79%-15% lead over Goldwater.    That left thirteen elections.  The figure shows the Democratic lead in the election and in polls taken the previous November:


There is clearly a relationship:  if you regress the election lead on the poll lead, the estimate is about 0.5, and the estimate for the intercept is near zero.   So for the purposes of prediction, you should cut the current lead in half.  The standard error is about 6.   So while it's obviously better to be ahead than to be behind, a small lead at this point doesn't tell you much.   

The largest residual is for 1980, when Jimmy Carter had a 10-point lead in a November 1979 poll, but lost badly in the election.  The major reason for this was probably that 1980 was a bad year in terms of both the domestic economy and foreign affairs.  Another factor is that John Anderson entered the race as an independent candidate, and probably took more votes from Carter than from Reagan.  The next biggest residual is in 1984, when Reagan led Mondale by 53%-36% in November 1983 (an average of three surveys), and won by an even bigger margin in 1984.  The economy was improving in 1984, and relations with the Soviet Union improved after Gorbachev came to power.  These two cases are obviously relevant to the current situation, although given increased partisanship the potential for change might be smaller.

  The third largest residual is 2000--George W.  Bush had a 14-point lead (54-40) in November 1999--and there were five surveys, which all were pretty consistent.   There were no dramatic developments in the economy or foreign affairs, so what happened to eliminate Bush's lead?  This is just speculation, but as I recall, Bush had very good press early on.  This was partly because reporters seemed to like him and admire his efficient campaign, but also because they seemed to think that "compassionate conservatism" was an idea whose time had come.  I don't mean that they supported it--most reporters were liberals--but they believed that Bush was in tune with voters.  So my thought is that Bush's early lead reflected favorable media coverage, and that as people got to know him better, they didn't like him as much.  This isn't directly relevant to 2024, since voters already know both Trump and Biden.  But Trump was barred from Twitter in January 2021, and Truth Social doesn't have nearly as large an audience, so to some extent voters will be rediscovering him as they start paying attention to the campaign.  My impression based on perusal of Truth Social is that Trump has become less effective as a communicator:  he goes on at length about he's being unfairly persecuted and how people love him (e. g., a series of posts about his rapturous reception at a UFC event).  On any other topic, even attacking the other Republican candidates, it seems like he's just going through the motions.  So it's possible  that he'll lose ground as voters get more exposure to the new Trump.

[Data from the Roper Center for Public Opinion Research]

Wednesday, November 8, 2023

Predistribution and redistribution

 The change in the connection between education and party--a shift of educated voters towards the Democrats and less educated voters towards the Republicans--has received a lot of attention.  One popular view is that working class voters have moved away from the Democrats because the party no longer pays attention to their economic interests.  Writing in the New York Times, Pamela Paul says "When it comes to economics, the authors say, Democrats have too often pursued the interests of their own elites and donors. Since the 1990s, the party has pursued policies that worsen the economic plight of Americans who are not well off."  However, although you can find examples that arguably support this analysis, if you look at spending on a range of social programs, the idea that the Democrats have stopped trying to help people with low and moderate incomes doesn't hold up:  see this post.  A new paper by Ilyana Kuziemko, Nicolas Longuet Marx & Suresh Naidu offers a more promising idea:  that education affects relative support for "predistribution"--policies designed to affect jobs and wages--versus "redistribution."  Less educated people tend to favor predistribution, while more educated people favor redistribution, so as educated people have come to have more influence in the Democratic party, policies have shifted towards redistribution.  Thus, although they are still trying to help the working class, they're doing it in a way that has less appeal to the working class.  

As an example of the effect of education on different kinds of opinions, here is the percent of college graduates and others who take the liberal position on some questions from a 2015 CBS News/NY Times survey:

          Not grad grad    Difference

Tax stock transactions 35 39        4
Tax million incomes     69 69      0
sick leave          86 85       -1
caregiver leave 83 79       -4
Union power         45 40      -5
trade restrictions         69 64         -5
Minimum wage $15         40 35         -5
Minimum wage $10     75 69          -6
limit CEO pay         56 45       -11
schedule notice 78 66       -12
Distribution fair 75 63        -12

Positive numbers in the "difference" column mean that college graduates are more liberal than less educated people; negative numbers mean they're more conservative.  Most of the figures are negative, but if you look more closely there's a pattern--more educated people are equally or more liberal when it comes to raising taxes on people with high incomes, but more conservative on things that involve direct regulation.  The biggest difference ("schedule notice") is for a question about whether hourly workers should be given two weeks notice of any change in hours worked or compensated with overtime pay.* None of the differences are especially large, but they are consistent, so they can contribute to a general image of the parties.  

I think that their analysis explains at least part of the shift in party support, and I've made a similar but less systematic account in this paper, although I think that the effect of education on economic opinions has also shifted in a liberal direction--definitely on redistribution, but probably on predistribution as well.  Finally, there's a question of whether the shift led to a change in overall support for the parties?  A New York Times article by Peter Coy on the Kuziemko et al. paper says it does--the title is "How Democrats Lost Voters With a ‘Compensate Losers’ Strategy."  But the paper doesn't actually discuss this issue, and in principle it could go in either direction--the gains among educated voters could be bigger, smaller, or equal to the losses among less educated voters.  I'll discuss this point more in a future post, but at this point I'll just observe that the assumption that this shift is bad for the Democrats is revealing in itself--there is now a general idea that it's better to appeal to the "working class" than to "elites."  So Democrats worry about the shift, while Republicans are proud of it.

[Data from the Roper Center for Public Opinion Research]


* I take support for trade restrictions as the liberal position.  In addition to the policy questions, I also show the results for a question on whether the overall distribution of income is fair.  

Monday, October 30, 2023

From ignorance to knowledge and back again

 I didn't intend to post again this soon, but I read a story in the New York Times and saw this passage:  "In the United States, surveys point to declining civics understanding among adults [which leads] to weaker social discourse and faith in public institutions."  I don't think that there has been a general decline in civics understanding, or that lack of civics understanding in the public is a major source of the problems with our political culture, so I wanted to check their evidence.  

On clicking the link, I found it led to a legitimate survey sponsored by the Annenberg Center at the University of Pennsylvania, and the report was called "Americans’ Civics Knowledge Drops on First Amendment and Branches of Government."  So far, that seems to support the statement in the Times.  On reading further, I saw that the drop was relative to the previous year (2021), and it was dramatic--e. g., when asked what rights were guaranteed by the First Amendment, 20% named freedom of the press, down from 50% in 2021.  Going back further, 42% mentioned freedom of the press in 2020, and 14% in 2017.  So either we've had a big decline or a small increase in knowledge, depending on your starting year.  Something is wrong--you might get a large increase in knowledge on issues that suddenly come into the news (e. g., knowing where Ukraine is located), but this is something that people learn in school, if they learn it.  So you're not going to get large changes from year to year--you could get large changes over a long period of time, but they would involve the accumulation of small changes in the same direction. 

What explains the differences between the years?  With open-ended questions, the number who give responses is affected by the amount of encouragement they get from the interviewer--e. g., if someone says "I don't know," whether the interviewer says something like "just your best guess is OK."  This is particularly relevant to the First Amendment question, since multiple answers are possible.   Suppose someone answers "freedom of speech" and then pauses:   the interviewer could move to the next question, or could ask "anything else?" So my guess is that the exact instructions given to the interviewers changed over the years (or possibly the way they were paid in a way that changed their incentives--like hourly rate versus completed interviews).  The site has a report on sampling and weighting, but nothing on the exact instructions, so I can't check. 

You would think that someone involved in the project would realize that the numbers looked strange, and checked to see if the apparent changes in knowledge actually reflected some change in the survey procedures.  But they just presented them as straightforward changes in knowledge:  for example, the 2020 survey report was titled "Amid Pandemic and Protests, Civics Survey Finds Americans Know More of Their Rights."  I'm not saying that it's impossible that there were large year-to-year increases and declines in knowledge--just that it would be unusual enough to deserve close examination before saying that it happened.   


Sunday, October 29, 2023

Criminal tendencies, part 2

 In my last post, I said that perceptions of change in crime rates responded to actual conditions.  This post looks as party differences.  The proportion of Democrats and Republicans who think that crime is increasing in their area (independents are in between--I leave them out to make the figure more readable):


Under Biden, there's been a large partisan gap, with Republicans more likely to believe that crime has increased.  But a partisan difference existed before then--the average perception of an increase by administration:

                      Dem         Rep              Difference

GHW Bush    54%         46%                     -8%
Clinton           38%         41%                     +3%
GW Bush       45%         36%                     -9%
Obama           42%         53%                     +11%
Trump            40%         37%                     -3%
Biden             41%         70%                     +29%

The party difference was positive (meaning Republicans were more likely to see an increase) under all three Republican administrations and negative under all three Democratic administrations.  That is, people see things as better when their party is in power.  But the effect seems to be bigger for Republicans.  This is clear when you look at years when party control changed*:

                      Dem     Rep    Ind

2000-2001     -2%        -17%     -5%
2008-9           -1%        +13%    +7%
2016-7           +4%       -18%      -3%
2020-21         +3          +29%      +9%

In previous posts, I found that with  views about the future of the next generation Republicans were more affected by party control than Democrats were, but that with  ratings of current economic conditions Democrats and Republicans were about equally affected.  

If views are affected by both partisanship and actual conditions, that raises the question of whether the affect of conditions differs by party.  I couldn't get any definite results on that point.  

*There was no survey in 1993, 1994, or 1995, so it's not possible to judge the Bush-Clinton transition.  

Friday, October 27, 2023

Criminal tendencies

 People sometimes say that we are moving into a "post-truth" world where facts have less influence on what people think than they used to.  Paul Krugman had a column on perceptions of crime which didn't explicitly endorse this analysis, but seemed to lean in that direction.  He concluded "The good news is that . . . we seem to be heading back to the prepandemic normal of fairly low crime. The bad news is that the politics of fear can work, even if there isn’t much basis for those fears."   The column referred to a Gallup poll from October 2022 that found 56% of people thought that crime had increased in their area in the last year, which was the highest figure since they started asking the question in the early 1970s, even though the actual crime rate is substantially lower than it was in the 1970s and 1980s.


However, although the Gallup question speaks of more or less, some people volunteer that it's about the same.  In 1981, 54% said there was more crime in their area, 29% the same, and 8% less; in 2022, it was 56%, 14%, and 28%.  In general, the percent of "same" answers has been declining, so looking at changes in the average gives a different impression than looking at the "more" answers.

The figure shows the average, counting more as 1, less as -1, and same as 0.  There was a jump from 2020 to 2022, but the 2022 figure is still lower than the values for most of the 1970s and 1980s.  Also, perceptions seem to have responded to the decline in crime in the 1990s and early 2000s.  So if you consider the "same" answers, perceptions seem to have a better match to actual conditions.

I estimated a model in which perceptions depend on perceptions the last time the survey was taken and the change in the homicide rate over the last three years.*  The estimates are:

.029+(.90^gap)*LY+.053*X, where LY is perceptions in the previous survey, X is the change in the homicide rates and gap is the gap in years between the current survey and the previous one.  The estimated coefficient for X has a t-ratio of about 3.  

This is a pretty crude model, but it suggests that if we are returning to a period of lower crime, that perceptions can be expected to follow--or to put it another way, the "politics of fear" have less effect when there's less to fear.  However, Krugman also pointed to Gallup results indicating that Democratic and Republican perceptions of changes in crime rates have diverged recently.  I'll consider that issue in my next post.  

*I'm following the analysis in a post from 2014, in which I said I "used the last three years rather than the last year because I figured people probably didn't take the time frame all that literally."  That is, I just picked it because it seemed reasonable to me, not because I found it fit better than other possibilities.

[Data from the Roper Center for Public Opinion Research]


Tuesday, October 24, 2023

Strong feelings, part 3

 In a recent post, I said "Trump doesn't seem to have an exceptionally large number of enthusiastic supporters among the public . . . his continued strength in the party is mostly because of Republican elites' reluctance to challenge him..."  Andrew Gelman pointed to my discussion on his blog, and this post is partly inspired by the comments--not a point-by-point response, but expanding on and clarifying what I was trying to say.  

As of the 2020 election, Trump had a lot of enthusiastic supporters in the public--15.4% of respondents in the American National Election Studies survey rated him at 100 on a 0-100 scale, which is the second-best figure since the question was first asked in 1968.  But in 2016, only 6.4% did, which is below average.  So Trump didn't start with a lot of enthusiastic supporters--he acquired them when he was president.  How did he do that?  Here's a table showing the percent of 100 ratings for presidents in election and re-election campaigns.

                 first       re-election

Nixon              13%           15.5%
Carter              13.7%          7.8%
Reagan             5.5%          12%
GHW Bush    11.7%           4.7%
Clinton             4.9%          10.7%
GW Bush         5%             14.6%
Obama            11.6%          13.9%
Trump               6.4%          15.4%

Nixon and Obama had small gains--the other six had large changes--four up and two down.  Trump had the second biggest increase, behind George W. Bush.  

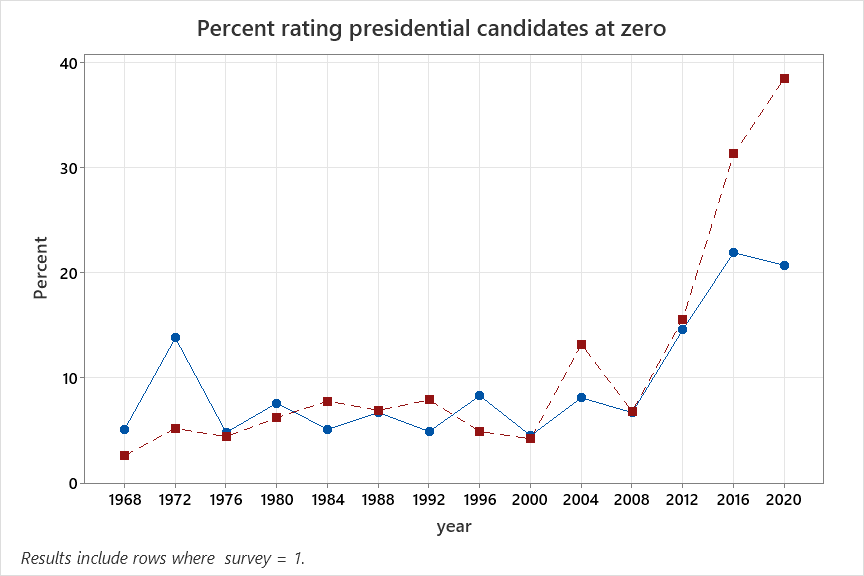
Here's the same kind of table showing the percent zero ratings.

             first       re-election

Nixon              2.6%            5.2%
Carter              4.8%            7.6%
Reagan             6.2 %           7.8%
GHW Bush      6.9%            7.9%
Clinton             4.9%            8.3%
GW Bush         4.2%          13.2%
Obama             6.7%           14.6%
Trump             31.3%          38.5%

It increased for all of them--Trump's increase was the third largest in absolute terms, behind George W. Bush and Obama.  

So overall, there's a tendency for extreme reactions to become more common during a presidency.     This tendency may have become stronger in the 21st century, which is reasonable given the general increase in polarization--supporters of the president's party rally around, while supporters of the other party rally against him.  

The ANES surveys are taken only once every four years.  Some other organizations ask "feeling thermometer" questions, but their not very common.  But to get a sense of the timing of the increase in strong support for Trump, we can use questions that distinguish between very and somewhat favorable.  The were pretty common during Trump's presidency--in fact, because of limitations of time and energy, I just recorded a selection.  


There's a fairly steady upward trend.  The two lowest values are from Spring 2016, when Trump was about to secure the Republican nomination and many Republicans were trying to make a stand against him.  I may record the rest of the data and try to do a more detailed analysis of the ups and downs later, but at this point the key thing is that it's an upward trend that seemed to last through his presidency. 

My last post showed that there's been a decline in Trump's very positive ratings since his presidency ended, but it's been pretty small.  As I said, I think that's because Republican elites have been reluctant to criticize him--I don't mean to denounce him as a threat to democracy (you couldn't expect that) but to say that he lost an election, and lost by a pretty big margin to an underwhelming opponent.  Why?  One reason is simply the belief that he has an unshakeable base of personal support, so you can't afford to antagonize him.  Another is that his charges of a stolen election, although they didn't convince many people, diverted Republicans into talking about "irregularities"--were the Covid-related changes in election procedures adopted improperly?  Were they intended to help the Democrats?  Were social media companies biased?  On these points, many or most Republicans were inclined to agree with him.  (That seems to be one of Trump's general strengths--the ability to bring something up from out of left field and get people talking about it.)  So the normal debate about the reasons for defeat that usually starts right after the election was delayed, and then delayed again by January 6 and the impeachment.  Since the debate hadn't taken place, Trump's support held up, and since his support held up, people were reluctant to raise the issue.    

[Data from the Roper Center for Public Opinion Research]

Saturday, October 14, 2023

Strong feelings, part 2

My last post was about ratings of presidential candidates at the extreme values on the ANES "feeling thermometer." Donald Trump set a record for extremely low (0) ratings in 2016, and broke it in 2020.  In 2016, he had an average level of 100 ratings--in 2020 that rose to the second-highest since they started asking the question in 1968.  The same question has been asked a few times since the election in Pew surveys.*  The percent giving 0 and 100 ratings:


The first point is the ANES survey, which was taken just before the election, and the second was a Pew survey taken shortly after.  Both showed about 15% rating Trump at 100, but that fell to 10% in March 2021 and remained there in July.   Many people accept Trump's claims has an unusually large core of enthusiastic supporters who will stick with him through anything--"I could shoot someone on Fifth Avenue..."--but in fact there have been substantial ups and downs in the percent who rate him at 100.   

Another point that struck me in the ANES data is is that there was little variation in zero ratings through 2000, with the exception of George McGovern in 1972, but there was a jump with George W. Bush in 2004.  That was a sign of things to come, so I wanted to look more closely at Bush's negative ratings.  The "feeling thermometer" question was only asked a few times, but there were frequent questions asking if your view of him was very favorable, somewhat favorable, somewhat unfavorable, or very unfavorable.  In fact, I there were enough so that I didn't use all of them, just a selection.  The percent who chose "very unfavorable":
They were pretty steady from May 2000 until April 2003, but very unfavorable ratings rose to 25% by February 2004 and then stayed high, before rising again in 2008.  So the Iraq war seems to have been the key.  It's not surprising that it had an effect, but it is noteworthy that the controversy over the 2000 election apparently didn't.  The 2004 election also didn't make much difference, contrary to what is sometimes said--very unfavorable ratings fell from 34% in October 2004 to 25% in January 2005.  It's also striking that Bush had a large number of very unfavorable ratings even before the financial crisis--44% in 2008, when we were in only a mild recession.  Finally, his very unfavorable ratings dropped after he left office.  I'm not sure if that's a general tendency with former presidents, but it is different from Trump, who just had a small decline in zero ratings.  


* Pew also asked question in 2022, but the data haven't been released and they only report the results in ranges.

[Data from the Roper Center for Public Opinion Research]

Saturday, October 7, 2023

Strong feelings

 A couple of months ago, some people were saying that Donald Trump's favorability ratings rose every time he was indicted (I've forgotten specific references, but I know I saw some).  The idea seemed to be that some supporters had been drifting away until their sympathies were reawakened by what they regarded as persecution by the "deep state".   Closer examination has shown that this isn't true, that his favorability ratings actually declined slightly after the indictments.  But at the time, it occurred to me that  the degree of favorability might be more subject to change--shifting from "strongly favorable" to "somewhat favorable" is easier than shifting from favorable to unfavorable--and that the degree of favorability will matter in the race for the nomination.  On searching, I found there aren't many questions that ask for degree of favorability, and that breakdowns by party weren't available for most of them.  However, the search wasn't useless, because it reminded me of the American National Election Studies "feeling thermometers" for presidential candidates, which ask people to rate the candidates on a scale of zero to 100.   Here is the percent rating the major party candidates at zero:


With the exception of George McGovern in 1972, everyone was below 10% until 2004, when 13% rated GW Bush at zero.  In 2008, things were back to normal, with both Obama and McCain at around 7%, but starting in 2012, zero ratings increased sharply.  


The next figure shows the percent rating each candidate at 100.  There is a lot of variation from one election to the next, but no trend.  In 2016, 6.4% rated Trump at 100, which is a little lower than average (and the same as Hillary Clinton).  He rose to 15.4% in 2020, which is the second highest ever, just behind Richard Nixon in 1972.  But several others have been close, most recently Obama in 2012 and Bush in 2004, and it's not unusual for presidents to have a large increase in their first term (GW Bush, Clinton, and Reagan had similar gains).   That is, Trump doesn't seem to have an exceptionally large number of enthusiastic supporters among the public (also see this post).  I think his continued strength in the party is mostly the result of Republican elites' reluctance to challenge him, which is a mixture of genuine support and exaggerated ideas about his strength among Republican voters.  

Saturday, September 23, 2023

Tit for tat?

 This is a follow-up to my post arguing that American political institutions, which were traditionally held to reduce polarization (and probably did), promote it given the conditions that prevail today (viz., parties that are  distinguished by ideology).  A new book by Steven Levitsky and Daniel Ziblatt that makes the same general argument has been getting attention, so I thought I should say how my view differs from theirs.  Levitsky and Ziblatt say that the main problem is institutions that work against majority rule, like the Senate, the Electoral College, and gerrymandered congressional districts.  As Michelle Goldberg summarizes it "The Constitution’s countermajoritarian provisions, combined with profound geographic polarization, have locked us into a crisis of minority rule."  However, in recent years the institutions that are more majoritarian have been more of a problem.  For example, most of the Republican members of the House of Representatives voted against "certifying" the 2020 election, but only a few of the Republican members of the Senate did.  It's the House, not the Senate, that has tried to use the debt ceiling as a political weapon.  Judges, including judges appointed by Trump, almost unanimously rejected Trump's attempts to overturn the results of the 2020 election.  Since the election, Republican-controlled state legislatures have made efforts to change electoral rules to benefit Republicans.  I think that the difference between the Senate and the House and state legislatures arises because Senators have a higher profile--someone who goes against the party may be able to survive, and even to benefit.  But Representatives and members of the state legislature are unknown to many of their constituents.  So the logic of trying to appeal to the "median voter" doesn't hold for them--the median voter probably won't even know what they've done, and will treat them like any other Democrat or Republican.  But party activists will know, and may support a primary challenge or withhold financial support.  

I also want to elaborate on my point about the complexity of the American political system, especially the electoral system.  That provides opportunities to take advantage of the system--figuring out some angle you can use to get your way.  Of course, if you do that, the other party is likely to retaliate, and the possibility of retaliation can be an effective deterrent.   But the complexity of the system also means that there's room for disagreement about whether an action is out of bounds, or how severe an infraction it is.  So the other side commits some offense, you retaliate in what you regard as a reasonable and proportionate manner, and then they are indignant about what they regard as a grossly excessive reaction.  It's even possible to take offense at things that haven't happened, but that you think might happen.  For example, a Washington Post column by Jason Willick discussing the argument that Trump is ineligible to run for president:  "What is sure to be a well-funded and well-coordinated campaign to disqualify Trump from office has begun.... Champions of 'automatic' disqualification have one pragmatic objective in mind: Eliminating Trump from U.S. politics. So what if they turn the 14th Amendment’s Section 3 into a Red Scare instrument in the process? ...  populists will someday have another chance in government. At that point, liberals might come to regret having legitimated the 14th Amendment as a quasi-authoritarian tool for purging political opposition."  During the 2020 election campaign, the Claremont Review talked about how Democrats would try to overturn a Trump victory.  And if the hypothetical action you became indignant about doesn't happen, you don't have to conclude that you were wrong--you can conclude that they surely would have done it if we hadn't called them out.  

 And finally, some data.  In 2016, a CNN/ORC poll asked people if they thought Trump would concede if he lost the election and then asked the same question about Hillary Clinton.  About 65% said that Trump would not concede, and 25% said Clinton would not.   Answers were strongly related to who you favored--Trump supporters were more likely to say that he would concede and less likely to say that Clinton would, and Clinton supporters were more likely to say that she would concede and Trump wouldn't.  But that wasn't the only thing that made a difference:  more educated people were more likely to say that both would concede.  The percent expecting each to concede, by candidate preference and education:

Not college grad                  Trump                Clinton

Trump supporter                     52%                    57%
Clinton supporter                    19%                    92%
Neither/DK                              22%                    63%

College grad                        Trump                Clinton

Trump supporter                     67%                    70%
Clinton supporter                    26%                    95%
Neither/DK                              30%                    77%

Similar questions were asked in 2020, with similar overall results, although I can't get the breakdowns.  The point is that some Trump supporters could justify his refusal to concede by a belief that the Democrat wouldn't have conceded either.  

[Data from the Roper Center for Public Opinion Research]

Thursday, September 14, 2023

"Fraud!" cried the maddened thousands

In 1959, the Gallup Poll asked "In your opinion, do you think there may be dishonesty in the voting or counting of votes in your district?"  They repeated that question in 1964 (as I once said, it's interesting that they didn't repeat it in late 1960, since that election was very close and there were allegations that voter fraud had made the difference).  That's the only question on voter fraud I can find until the 21st century.  Although the recent questions have been worded differently, I think that they are similar enough to make a comparison useful, so I give it below.  The first column is pessimistic responses--agree that there may be dishonesty or not confident (combining not too and not at all) that votes will be accurately cast and counted.    

 "In your opinion, do you think there may be dishonesty in the voting or counting of votes in your district?"

April 1959    13%    71%
March 1964  13%    69%

"How confident are you that, ______ , the votes will be accurately cast and counted in this [or next] year’s election?"

                    where you vote                     across the country
Oct 2006         8%      91%                                 25%      75%
Nov 2007      12%      88%                                 30%      71%
Aug  2016     16%      81%                                 36%      62%
Oct   2016     14%      84%                                 33%      66%
Sept 2020      21%      79%                                 41%      59%

In 2006-7, negative responses for "where you vote" were below the level of negative responses for "your district" in 1959-64.  In 2016, they were a little higher, and in September 2020, they were clearly higher.  In 1959 and 1964, there were a substantial number of don't know answers--in the 21st century, very few.   I don't think that's specific to this issue--there seems to have been a general decline in don't know answers over the years.  On this question, I'd regard don't know as closer to an optimistic answer--that is, saying that you don't know of any reason to think so.   But if you count some of the don't knows as pessimistic answer, that just reinforces the point that pessimistic answers were more common in 1959 and 1964 than in the early 2000s.  

In the 21st century, they also asked about "across the country" (the different questions were given to random halves of the sample).  Pessimistic answers were consistently higher, but they followed the same course of change over time.  

This is related to the issues I discussed in my last post.  General trust in people and confidence in institutions, especially political institutions, has been declining for a long time.  To the extent that views of elections reflect general trust, you would expect them to be more negative in the early 2000s than in the 1950s and 1960s.  But they weren't, and may even have been more positive.  I've mentioned a question asked in a Washington Post survey shortly after the Supreme Court ruling gave George Bush the victory in 2000:  "Whatever its faults, the United States still has the best system of government in the world":   89% agreed, including 85% of Gore supporters.  That is, a general loss of confidence in institutions didn't lead to a loss of confidence in elections, because politicians and journalists kept up a tradition of not just accepting the results, but celebrating our electoral system and history after an election.  It wasn't until Trump broke from that tradition that public confidence fell.

[Data from the Roper Center for Public Opinion Research]

Tuesday, September 12, 2023

Crisis, what crisis? Part 2

 In my last post, I said that I didn't think that contemporary political problems in the United States are a reflection of social problems (the loss of meaningful connections) or economic problems (lack of growth in working-class standards of living), but of failures of political leadership.  But that raises the question of why political leadership has become worse. 

One part of the answer is a combination of American political institutions and changes in the nature of parties.  The institutions worked reasonably well when parties were loosely organized and not very ideological, but when the parties are ideological, they create bad incentives for politicians.  One reason is the dominance of the two-party system means that negative partisanship can be at least as effective as trying to make a positive appeal.   Another is that the complexity of the system means that there are lots of ways to try to manipulate the rules to your benefit.  Complexity also means that there are opportunities to take a symbolic stand without worrying about the consequences--you can leave it to someone else (often the courts) to do the "responsible" thing.  An example of that is the Texas v. Pennsylvania suit, which was supported by most Republican attorneys general and members of the House of Representatives:  they knew that the Supreme Court would decline to hear it, so it wouldn't really make any difference but they would get credit with the "base."  But all of these have the effect of making the public more discontented with politics, and therefore more likely to support outsiders who promise to cut through the partisan wrangling but usually make it worse.  

These considerations apply to both parties, but there is a difference between the way that they've responded.  Republicans were more vigorous in playing "constitutional hardball" even before the 2020 election.  Also, there's a difference in their treatment of extreme positions.  Few Democratic politicians expressed support for "defund the police," and those who did tried to say that they didn't mean it literally, they just wanted to move some resources from policing to social service.  But in every race for the Republican presidential nomination, some candidates will propose abolishing the IRS, or several cabinet agencies, cutting the federal workforce in half, etc..  Another way to look at it is that it's fairly common for Democratic politicians or pundits to say that the party needs to move to the center on certain issues, but Republicans almost never say that--even proposals for reform are presented as something uniquely conservative, not as moves to the center.  

I think that the explanation for this difference is that American conservatism sees itself as being in opposition to the "elites."  William F. Buckley is generally agreed to be the founder of the modern conservative movement, and his first two books were not about New Deal policies, or labor union power, or policy towards the Soviet Union, but about Yale University and "McCarthy and his enemies"--that is, both were directed against what he called "our disintegrated ruling elite."  That sense of alienation has grown as "elites" have moved towards the left.  Consequently, conservative politicians don't feel much obligation to be "responsible"--they are just interested in expressing opposition.  

Tuesday, September 5, 2023

Crisis, what crisis?

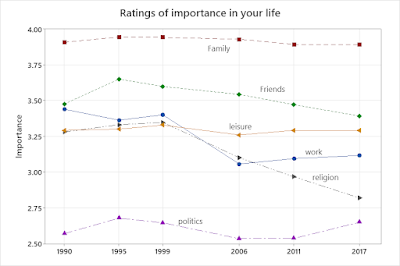
I'm returning to the question of whether American values have changed:  specifically, whether there's been a move towards money and careers and away from personal relationships.  Following a suggestion from Claude Fischer, I looked at the World Values Survey.  Starting in 1990, it has a series of questions asking how important various things are in your life:  very important, rather important, not very important, or not at all important.  People are asked about family, friends, leisure time, politics, work and religion.  The average ratings in the United States:


Religion and work have clearly declined, while the others don't show any clear trend.  In 1990, family ranked first, then friends and work almost tied, then leisure and religion almost tied, then politics far behind.  Now it's family, friends, leisure, work, religion, politics.   Whatever you think about the decline in ratings of religion and work, people aren't turning away from personal relationships.

Part of the reason I am interested in this issue is that many people say that the problems in American politics today reflect problems in society.  There are many variants of this analysis, but the idea that people have become more focused on themselves is a popular one.   Nicholas Kristof offered another one  the other day--that they result from stagnation or decline in working-class standards of living--so while I'm at it I'll look at his evidence.  Kristof says:  "Average weekly nonsupervisory wages, a metric for blue-collar earnings, were actually higher in 1969 (adjusted for inflation) than they were this year."  He doesn't link to his source, just says it's from the Bureau of Labor Statistics, but I tried to reconstruct it from the Federal Reserve Economic Data.  

He's right--in fact, average weekly nonsupervisory earnings are lower then they were in 1965.  There's been an increase in part-time work since the `1960s, which is related to increased labor force participation by women, so I also show the figures for real hourly wages.  They give a more optimistic picture, but still say that there's been essentially no progress since 1973.  However, there are actually two offsetting periods of change:  a decline from the early 1970s until the mid-1990s and a pretty steady increase since that time.  So any reaction to economic distress should have occurred in the 1980s or 1990s, not in the last few years.  Of course, these figures aren't definitive, but they're what Kristof uses.

So what is the problem?  I agree with another New York Times columnist, David French, that it's primarily one  of political leadership.  Of course, that raises the question of why the quality of political leadership has declined.  I've had several posts that touch on that issue, but haven't addressed it directly--I'll do that in the near future.