Monday, August 29, 2022

Those awful elites

 Thomas Edsall had a column about threats to democracy, particularly in the United States.  He suggested that the problem wasn't just elite behavior, but also declining popular support for democratic institutions, and quoted various experts on why that might be happening.  One idea that several proposed was that the public was reacting to failures of economic policy.  According to Daron Acemoglu, an economist:  "both center-right and center-left politicians promised huge gains from globalization and technology for everybody, and aspirations rose. And many groups were disappointed and frustrated with either slow or sometimes no economic progress."  Jack Goldstone, a sociologist:  "more rigid and culturally divided inequality breeds resentment of the elites. And I would say the elites brought this on themselves, by creating meritocratic bubbles that demean those outside and access to which they increasingly control for their own families. The elites have implemented policies of globalization, meritocracy and market-driven morals ... while ignoring the widespread harm these policies have done to many millions of their fellow citizens."  And Elizabeth Suhay, a political scientist: "elites are an indirect cause of the rise of authoritarian parties. The neoliberal policies they have championed have led to increased inequality, stagnating wages and a weaker safety net for most citizens. Economic distress, pessimism and precarity increase citizens’ interest in radical political candidates and policies on both sides of the political aisle."  The common theme is that the prevailing policies have been good for elites but not for the general public, so ordinary people turned against, not only those policies, but the elites who had pushed them.

The common assumption behind these accounts is that people have become discontented with their general economic prospects:  that they don't feel like they're making progress, or are making progress in the future.  Is this true?  There are lots of survey questions about current economic conditions, but not as many on general evaluations of your life.  However, the General Social Survey has included this one since 1994:  "Compared to your parents when they were the age you are now, do you think your own standard of living now is much better, somewhat better, about the same, somewhat worse, or much worse than theirs was?"  The means*, counting "much better" as 5, "somewhat better" as 4, and so on:


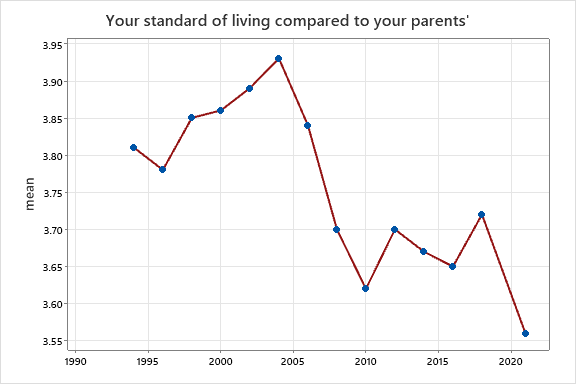
It generally rose until the early 2000s, and then declined.  It started falling before the "Great Recession" and never really bounced back--in 2018, it was only slightly above the 2008 level.  (It hit a low in 2021, but that could reflect disruptions of life caused by the pandemic.

Breaking it down by some demographic groups:


In the 1990s, non-graduates had slightly more positive assessments than college graduates, but they have fallen behind since the early 2000s.


No clear difference between men and women in terms of the changes.


Also no clear difference by race.**  There's a good deal of sampling variation in the estimates for blacks, so it's hard to say about short-term changes.  But there's no general tendency for one group to pull ahead of the other.  


There are differences by age group.  Despite what people often say, it's was the older age groups that saw themselves slipping:  in 2018, people aged 25-39 were more likely to see themselves as ahead of their parents than people aged 25-39 had been in 1994 and 1996.  The assessments of young people became considerably more negative in 2021, but again that could be a short-term reaction to the pandemic.  

These results support the accounts given above in two respects:  there's been a general decline in the 21st century that doesn't track immediate economic conditions, and it's been more pronounced among less educated people.  But if you look at the values on the y-axis, they are all well above 3.0:  that is, in all groups at all times, the prevailing opinion is that their life is better than their parents was at the same age.  For example, in 1994-2000, 65% of people without college degrees said that they were ahead of their parents' standard of living and only 13% said that they were below.  In 2010-21, that had slipped to 59% ahead and 15% below, but that's still a solid margin on the optimistic side.  The changes are also pretty small--there have been occasional questions about expectations for the next generation, and those have shown much larger changes.  So overall, I think that there is an anti-elitist mood today, and it often shades into an anti-democratic mood, but I don't think that it results from dissatisfaction with one's own economic situation.  


*All of the figures are limited to people born in the United States.  

**I just show black and white--the number in other races is too small to be informative.  


Monday, August 22, 2022

Citation analysis

 The New York Times recently had a story called "Pain in children is often ignored.  For children of color, it's even worse."  That story mentioned "an often-cited study published in 2016 in the Proceedings of the National Academy of Sciences" on pain treatment recommendations.  It turns out that I blogged about that article a few years ago.  When I checked, I found that it had 1404 citations in Google Scholar.  Articles in medicine and public health tend to be cited at high rates, but that's still a lot.  However, that's not what this post is about, it's just how I got started.

I read one of the articles that cited the PNAS paper and found a reference to a study of trends in killings by police between 1960 and 2010.    There are several recent data sets on police killings, but I didn't know that there was any historical data at the national level, and assumed that there wasn't any (see this post for some data on New York City).   The study used data from death certificates, which include a category for "legal intervention" (formerly "injury by intervention of police"). They just considered men aged 15-34, so I went back to the original data. The 1968-2016 data are available from the National Center for Health Statistics, which has a convenient online tool, and the older data are in annual issues of Vital Statistics of the United States. The basic figures:


For example, in 1960 125 white people and 119 non-whites were recorded as dying from "injury by intervention of police."  There were about 175 million whites and 17 million blacks, giving about 0.7 deaths per million among whites and 5.4 million among blacks.  The black rate is slightly overestimated, since some of the non-whites were not black, but the effect is probably small (in 1968, they shifted to black, white, and "other race," and there were only 3 in "other race").  

The rate of deaths among blacks rose in the 1960s, but then declined and has remained about the same in the 21st century.  The original study just reported data with minimal interpretation, but the paper that cited it (published in the New England Journal of Medicine and cited 478 times since its publication in 2021) said "the late 1960s also saw a massive spike in police killings of Black men," and didn't mention the decline after 1970.

The rate among whites looks like it has increased pretty steadily--in order to see it more clearly, here's the same graph with a log scale:


 If you look at the ratio of black to white death rates, it shows a long-term decline, from more than 8:1 in the 1960s to less than 2:1 in the latest years for which data are available (2014-16). 


Methodological appendix:  The death certificate data shows only about 500 deaths from "legal intervention" in the mid-2010s.  The data on deaths from police, which start at about that time, show at least 1,000.  My guess is that death certificates sometimes just give the physical cause of death--e. g., say that a person died from a gunshot wound and don't mention who fired the shot.  The rate of incomplete reporting could change over time and differ among races, and the racial differences could change over time.  So clearly these data aren't definitive, but they have potential.  Someone should do a more thorough analysis.    


Wednesday, August 17, 2022

Confidence in institutions, 1999-2022

 The latest round of Gallup data on confidence in institutions is out.  Confidence is down across the board, with especially large declines for the Supreme Court and the presidency.  Gallup also reports the breakdowns by party identification.  Republicans have most confidence in small business, the military, and the police, and least in newspapers, Congress, and the presidency; Democrats have the most in the military, small business, and the presidency, and the least in the Supreme Court, big business, and Congress.  I wanted to see if the pattern had changed, so I looked up the 1999 data.  (Small business was not included in the 1999 survey).  Among Republicans, the relative position of different institutions was very similar in 1999 and 2022, with a correlation of 0.93.  There was more change among Democrats, with a correlation of only 0.59.  

The correlation between Republican and Democratic confidence in different institutions fell from .66 in 1999 to .29 in 2022.  The gap between parties increased, with the average absolute difference going from 10.5 to 19.5.  The figure shows the partisan gap (absolute value of percent Democrats approving minus percent Republicans approving) for individual institutions.


The diagonal line indicates identical values in the two years:  for example, in 1999 43% of Democrats and 31% of Republicans had a great deal or quite a lot of confidence in TV news, for a difference of 12, and in 2022, 20% of Democrats and 8% of Republicans did, again giving a difference of 12.*   The partisan gap has stayed about the same for criminal justice, big business, Congress, banks, the military, organized labor and TV news, and grown for the Presidency, police, schools, the Supreme Court, organized religion, the medical system, and newspapers.  It seems that confidence in "the presidency" has become more closely linked to feelings about the current president--37% of Republicans had confidence in the presidency in 1999, down to 12 percent in 2021 and only 2 percent in 2022.  Democratic confidence in the Supreme Court has declined dramatically, from 57% in 1999 to 13% in 2022.  But the change is not symmetrical:  Republican confidence has also declined, although by not nearly as much.  Democratic confidence in the police and organized religion has declined, while Republican confidence has stayed about the same; Republican confidence in newspapers has declined, while Democratic confidence has stayed about the same.  

Republican confidence in schools stayed about the same until 1999, but has declined since then, including a drop from 20 to 13 percent from 2021 to 2022.  Democratic confidence has remained about the same over the period.  With the medical system, confidence declined among both Democrats and Republicans from 1999 to 2009--since then, it's continued to decline among Republicans but increased among Democrats.  I wonder if that is because of the Affordable Care Act?  Finally, Republican confidence in organized labor was slightly lower in 2022 than in 1999, despite their growing interest in being a "working class party," or at least talking about being one. (Democratic confidence was almost unchanged).  

Both the decline in the correlation between Democratic and Republican ratings and the rise in partisan gaps can be regarded as a decline in consensus or a growth in polarization.  The changes in the gaps for individual items are interesting, and I may look at some of them in more detail in the future.  But the point that I find most striking is the much greater stability of rankings among Republicans.  One reason for that was that the changes among Republicans were more uniform, and another one was that Republican lost more confidence in institutions that they already disliked.  In contrast, some of the biggest losses among Democrats were for institutions in which they had fairly high confidence in 1999 (Supreme Court, organized religion, the police).

*The decline among Republicans is larger in percentage terms:  about 75% compared to about 50%.  You could adjust for that by using logits, but that doesn't change the general conclusions, so I stayed with percentages in order not to make things more complicated.  

[Data from the Roper Center for Public Opinion Research]


Saturday, August 13, 2022

The era of (relatively) good feelings

Since the 1970s, the Gallup poll has asked people about how much confidence they have in a variety of institutions.  The 2022 Gallup data has recently come out, and I will write about it soon.  But today I will write about a different series of questions on confidence, from surveys sponsored by the Pew Research Center.  The general form is "How much confidence, if any, do you have in each of the following to act in the best interests of the public?"  [Institution].  Why look at these questions, when the Gallup series covers a much longer period of time?  One reason is that they consider a different group of institutions.  Another is that they are taken at irregular intervals, unlike the Gallup surveys, which are taken every June.  As it turns out, one of the Pew surveys was carried out in April 2020, in the early stages of the Covid pandemic; another in May-June 2020, when George Floyd was murdered and a wave of protests began; and another in late November 2020, just after the Presidential election.  As a result, the Pew surveys make it possible to look at the impact of these events.  

The Pew surveys regularly asked about scientists, medical scientists, elected officials, religious leaders, principals in public schools, journalists, police officers, business leaders, and the military.   Possible answers were "A great deal of confidence, a fair amount of confidence, not too much confidence, no confidence at all": I counted these as 4,3,2,1 and computed the averages.  I show these groups together because people had high confidence in all.  

It turns out that they had a similar pattern of change--rising from 2016 to 2019, then pretty steady despite everything that happened between January 2019 and November 2020, and then lower in the latest survey (December 2021).  


Principals have a similar pattern, although they are higher in April 2020, which may may indicate that people came together to support schools in the early stages of Covid.  Data for police starts only in 2018--there has been a steady decline since then.

Religious leaders have the same pattern of a rise followed by a fall, although it may be weaker than for some of the other groups.  Confidence in business follows a completely different course.  

Finally, two groups with low confidence:  elected officials and journalists.


The question about journalists wasn't asked until January 2019--there has been a steady decline since then.  Elected officials follow the more common pattern--higher in the Trump presidency, at least the later part, but then declining between November 2020 and December 2021.  

In November, I had a post using the Gallup data that also showed a general rise after 2016 (going through June 2021).  The general point that emerges from both analyses is that confidence in a variety of institutions tends to rise and fall together.  There's no way to be sure about what drives it, but I think that a combination of economic conditions and general satisfaction with politics are the most likely sources.  People often suggest that confidence in particular institutions mostly reflects the performance of those institutions.  For example, today's column by Ross Douthat said that confidence in science and public health experts has declined in the last few years because the "expert community" has departed from neutrality and allowed political goals to influence their recommendations.  There are certainly examples of that, but most people don't pay that much attention to the news, so things like the "Open letter advocating for an anti-racist public health response to demonstrations against systemic injustice occurring during the COVID-19 pandemic" don't have much impact.  In contrast, when prominent politicians saying that everything you've been told is wrong, even people who don't follow the news closely are likely to be aware of that.  

[Data from the Roper Center for Public Opinion Research]


Friday, August 5, 2022

Something new

 Most of my recent posts have involved the Supreme Court and/or abortion.  I'm sure I'll return to those topics, but this post will be on Social Security.  It's prompted by a blog post from Mark Palko, who notes that many observers think that the traditional Republican disadvantage on Social Security has disappeared.  The idea is that in 2016 Donald Trump pledged not to cut Social Security and Medicare and the party has followed him, as it has on many issues.  Mark questioned this account, but didn't have any data that directly addressed it, so I looked and found some.  

In most presidential elections starting in 1984, there were questions about which candidate would be better on Social Security.  They were not all by the same organization, so the wording varied.  Most of the variations were minor (e. g.  "handling" vs. "dealing with"), but in 1988 and 1992 they asked about "protecting the Social Security system" and in 2016 they asked about "Social Security and Medicare."   I calculated the difference between the percent naming the Democratic candidate and the percent naming the Republican.  The Democrat was always ahead, which is why I call the figure "Republican disadvantage."


In 2016, Trump trailed Clinton by 50-42%, giving an 8% gap, which was just about average--unfortunately the question wasn't asked in 2020.   Reagan in 1984 stands out as an unusually large gap, which is plausible because in one of his Presidential campaigns (I think it was his first, in 1976) he suggested that maybe Social Security should be privatized and got a lot of negative publicity.     Aside from that, there's no trend, and the ups and downs don't show any obvious pattern and are small enough so that they could be sampling error.  So there's not evidence that Trump changed anything--the Democrats consistently have an advantage on the issue.   This isn't really surprising--even someone who doesn't pay much attention to politics can tell that if forced to make a choice between tax increases and spending cuts, Republicans would be more likely to go for spending cuts and Democrats would be more likely to go for tax increases.  

So why do many observers continue to say that Trump changed perceptions?  I think that it's partly because of surveys showing that in 2016 Trump was regarded as less conservative than other Republican candidates, and partly because he did well among the "working class" (less educated people).  The idea that he positioned himself to the left on economic issues is appealing because it seems to explain both of those points.  However, I don't think that they actually had a common cause--the perception of him as less conservative probably involved social issues, while his appeal to less educated voters involved a combination of immigration and trade and personal style (blunt, not worried about offending people). 

[Data from the Roper Center for Public Opinion Research] 

Monday, August 1, 2022

Can't stop writing about the Supreme Court

 I will move on to other topics soon, but I found one more point about the Supreme Court that I want to mention.  In July 1991, the Gallup Poll asked "From what you know about Clarence Thomas, as a Supreme Court justice, do you think he would be too liberal, too conservative, or just about right?"  7% said too liberal, 20% too conservative, 46% about right, and 27% didn't know.  The same question has been asked about most of the other Supreme Court nominees since then (in all cases, very soon after they were nominated, before the hearings started).  The figure shows the expected bias (absolute value of "too liberal" minus "too conservative").


There's a clear tendency to increase, which can be seen as another aspect of political polarization, but there are a few nominees who depart from the trend.  Perceived bias was relatively low for Merrick Garland (6% too conservative, 25% too liberal) and high for Amy Coney Barrett (43% too conservative, 4% too liberal), and also for Elena Kagan (6% too conservative, 40% too liberal).  I was surprised by the results for Kagan--I didn't remember much controversy about her.  Her "don't knows" were unusually low, only 4%.  That may be because the question followed a number of questions that gave information about he.  The next figure shows the percent saying "about right":


There's no trend here, and Kagan doesn't stand out, but once again Garland and Barrett are exceptions.  The results for Garland aren't surprising, since he was perceived as a moderate.  But why does Barrett stand out, when Neil Gorsuch didn't?  Both were conservatives, both were nominated by Trump, and you might have expected Democrats to be especially negative about Gorsuch since he was filling the seat that had opened under Obama.  

The answer may be the justices they were replacing--Scalia for Gorsuch and Ginsburg for Barrett.  Replacing Scalia with Gorsuch didn't have much impact on the ideology of the court, but replacing Ginsburg by Barrett moved it substantially to the right.   After Scalia died, Gallup asked if you would like a justice "who would make the Supreme Court more liberal than it currently is, more conservative than it currently is, or keep the court as it was?"  32% said more liberal, 29% more conservative, and 37% keep it as it was.  Of course, replacing Scalia with Garland would have made the court more liberal, but he was regarded as more moderate than others Obama might have chosen, so people who wanted to keep things as they were would have been happy.  Unfortunately, the question about how people would like the Court to change was not asked in 2020, but if there was a similar desire to keep things about the same, replacing a liberal justice with a solidly conservative one would be unpopular.  

Like Barrett, Clarence Thomas moved the court well to the right--he replaced Thurgood Marshall, who was among the most liberal justices.  The fact that people were pretty satisfied with his nomination may reflect general trust, or maybe many people wanted the court to move to the right at that time (I'll try to look at that in a future post).  

[Data from the Roper Center for Public Opinion Research]