Wednesday, November 29, 2017

Make America Well-informed Again?

In the New York Times, Timothy Egan laments American's ignorance about government and public affairs, and says that things used to be different: "we have allowed the educational system to become negligent in teaching the owner’s manual of citizenship. . . . up until the 1960s, it was common for students to take three separate courses in civics and government before they got out of high school." 

It's not hard to find examples of widespread ignorance in recent years.  For example, in 2001 the Gallup Poll asked "What are the first 10 Amendments to the Constitution called?"  57% said the Bill of Rights, 6% gave an incorrect answer, and 37% said they didn't know.  When Gallup asked the same question back in the good old days (more specifically, in 1954), 33% said the Bill of Rights, 2% gave an incorrect answer, and 65% said they didn't know.  Knowledge didn't decline between 1954 and 2001--it increased.  

What about those civics courses students had to take in order to graduate?   At the time, many people didn't graduate from, or even attend, high school.  In the 1954 sample, about 32% had an 8th grade education or less and 24% had attended high school but not graduated.  That is, only a minority were high school graduates.  The percent giving the correct answer by educational level:

                                     1954         2001
HS or less                        27%        38%
Some College                  60%        61%
College graduate             74%        78%

The 2001 report didn't give a more detailed breakdown of education, but in 1954 46% of people who had graduated from high school and had no college got it right.  So within each educational level, there was little or no change between 1954 and 2001. Regardless of what people study in school, more educated people are more likely to follow the news, which means they are more likely to pick up new information and less likely to forget the things they once knew.

[Data from the Roper Center for Public Opinion Research]

Wednesday, November 22, 2017

Four more years

In a recent post, I referred to a post on changes in response to the question "What do you think the chances are these days that a white person won't get a job or promotion while an equally or less qualified black person gets one instead? Is this very likely, somewhat likely, or not very likely to happen these days?" It occurred to me that the post was from 2013 and the question is from the General Social Survey, which is conducted in even-numbered years.   So now data from 2014 and 2016 are also available, and a lot has happened in those years.

There are three possible responses:  very likely, somewhat likely, and not very likely.  The figure shows a summary measure of opinions (among whites--I also tried limiting it to non-Hispanic whites but it was about the same) since the question was first asked in 1990, plus upper and lower bounds of the 95% confidence interval--higher numbers mean less likely.


Opinions have moved steadily in the direction of seeing less chance that whites lose out to blacks--the correlation between year and the summary measure is over 0.9.  In 1990, about 28% said "very likely" and 30% "not very likely"; in 2016 13% said "very likely" and 39% "not very likely."

The movement has not been completely uniform--there was clearly a shift towards seeing it as more likely in 1994, and probably in 2002 and 2006 as well.  But the movement from 2008-16 was right on the trend, despite the election of a black president, the Black Lives Matter movement, and the Trump campaign.


Thursday, November 16, 2017

Revise and resubmit

After reading my last post, my esteemed friend Robert Biggert urged me to take a look at rates of immigration, and pointed to this column by Thomas Edsall, which argued that there was a turn towards Trump in places where there were few immigrants but the number was increasing rapidly.  Then this morning I saw another by Edsall which argued that there was a turn towards Trump in places where there were few "minorities" but the number was increasing rapidly.  The idea is that whites feel most threatened when they are first exposed to a significant number of "others."  After reading the first one, I got figures on the number of foreign-born people by state in 2000, 2010, and 2015.  I found the 2000-10 changes didn't make any difference to 2016 vote, but the 2010-15 changes did.  So I decided to limit my attention to changes in the black and Hispanic population since 2010.  The results from regressions with Republican gain over 2012 as the dependent variable (standard errors in parentheses):

Constant                 .026            -.062
                              (.013)           (.030)

Utah                         -.145         -.135
                                 (.021)        (.019)

Home                      -.040           -.046
                                (.017)          (.015)

Black (2010)           -.109            -.088
                                 (.028)          (.026)

Hispanic (2010)       -.131          -.096
                                 (.042)          (.038)

Foreign-born (2010)  -.084         -.041
                                   (.076)        (.068)

Disability                   .437            .649
                                  (.248)          (.226)

Grow10-15                                    .023
                                                     (.0063)


Adj. R-square            74.5%         75.4%


The last variable is the sum of the growth in black, Hispanic, and foreign-born population.  For each one, "growth" is the ratio of 2015 share to 2010 share.  The reason I used the sum is that when growth in each population was included separately, the group was statistically significant, but none of the individual estimates were.  Almost by definition, the largest values for growth occurred in places that had few "minorities" in 2010:  the states that ranked highest on Grow10-15 were North Dakota, South Dakota, Maine, Vermont, and Minnesota.  But the estimates for percent black and Hispanic in 2010 are still negative and statistically significant, so the conclusions from my previous two posts stand up.  (The estimate for foreign-born is negative although not statistically significant).  Going back to the "defense of whiteness" idea, these analysis suggest in the contemporary United States it's a temporary thing--it applies when "others" are first appearing but weakens or reverses as they remain.

Saturday, November 11, 2017

and why were they there?

As I said in my last post, Donald Trump did better than Mitt Romney had in states with few "minorities" (blacks or Hispanics) and worse in states with large numbers of "minorities."  I have read a lot of articles about the 2016 election, but don't recall anyone noticing this.  In a post from December 2016  I noted that some of Trump's biggest gains took place in states with few minorities, but I didn't follow up on it.  Here is a figure showing gain or loss over 2016 by percent black or Hispanic.  The correlation is about 0.5 for all states and 0.7 if you exclude Utah.  I don't think that it's likely to go away if you control for other factors, so how should it be explained? 


One popular analysis of the 2016 election was that it was about the defense of "whiteness," which is a mixture of prejudice and the rational (although selfish) defense of group interests.  People who advocate this don't pay much attention to regional differences--they generally focus on making a case that there's a historical pattern of white backlash after every move towards racial equality.   But it seems that this account implies regional differences too.  Racial interests will make more difference to white voters if the percentage of racial minorities is larger:  that is, minorities will be more of a threat where they are more numerous.  To the extent that Trump appealed to "whiteness," he should have gained more where the percentage of minorities was higher.  That is the opposite of what happened.*  So how can this pattern be explained?  The assumption of the usual account is that an appeal to "whiteness" will gain votes among whites.  But white opinions on race have changed a lot over time.  The decline in straightforward prejudice is well known, but whites have also seem to have become less likely to think that they are the ones who are discriminated against.  That suggests that an increasing number of whites will have a negative reaction to a "defense of whiteness" appeal--they will regard it as unfair.  Even whites in the middle--those who don't think there's much discrimination against either blacks or whites--may have a negative reaction because they think it will increase racial conflict. 

So my view is that to the extent that Trump appealed to "whiteness," that hurt him in much of the country.  The thing that helped him was an appeal to nationalism, as discussed in this post, among others.


*Another variant of this analysis is that Trump was no different from Romney, Bush, etc.:  they all appealed to "whiteness" and he was just cruder.  But this would imply no relationship. 


Sunday, November 5, 2017

Where were they?

By and large, the states in which Trump did well in last year's election were the states in which Mitt Romney did well in 2012.  The figure shows the Republican share of the Democratic plus Republican vote in the 2012 and 2016 election (the District of Columbia is not shown because it is off the scale).


Still, there were some shifts, and they made a difference to the outcome.  What sort of states shifted towards the Republicans?  One possibility is that it was ones that were struggling economically.  I saw a lot of stories about Midwestern cities where factories had closed down, or were threatened with closure, and people turned to Trump.  Another possibility is that it was places that were suffering from high levels opioid addiction--people could think that "get tough" policies were needed or just that the Obama administration hadn't been successful in dealing with the issue, either of which would help Trump.  High rates of disability could produce sentiment against "unworthy" beneficiaries of government programs (I proposed something along those lines in this post).  Although people sometimes talk like all of these go together, they are not all that highly correlated at the state level--the correlation between deaths from drug overdose and percent of the working-age population receiving disability benefits is about 0.4, and the correlations of the unemployment rate with overdoses and disability are both about 0.2.  Some regressions of the Republican share of the two-party vote in 2016 on these three variables plus various controls (t-ratios in parentheses). 

      u       od      d    Controls
1.  .006   -.0005   .013      2012
   (-1.2)  (-0.6)   (3.4)

2. -.0098   .0006   .006      plus Utah
    (-2.5) (1.0)    (1.9)

3. -.012    .001    .006      plua home state
   (-3.2)   (1.6)   (2.1)

4.  -.001   .0004   .004      plus % black, % Hispanic
     (0.3)  (0.8)   (1.4)

5.                  .005      same as #4
                   (2.1)


Utah was an outlier, and there was an obvious reason for that--independent conservative candidate Evan McMullin, who was a native of Utah and a Mormon, got over 20% of the votes there.  "Home state" was defined as +1 for Massachusetts and -0.5 for Illinois and Hawaii.  Both 2016 candidates were residents of New York, so only 2012 needed to be considered.  When dealing with American politics, it's always advisable to consider race and ethnicity, so I put in controls for black and Hispanic.  

Considering all of the regressions, it's clear that Trump did not do relatively well where the unemployment rate was high.  The rate of overdose deaths and disability always had the same sign, but disability was consistently stronger, so in the last regression I just considered disability.  The estimate is statistically significant, although not overwhelmingly so.  The disability rates range from about 3% to about 9%, so going from low to high is estimated to increase Trump's share by .03 (relative to Romney in 2012).   That's enough to be of interest.  

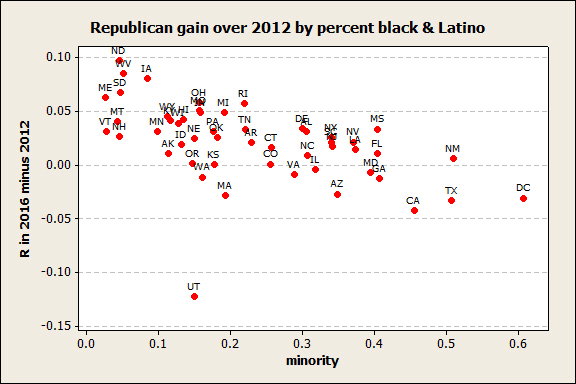
However, the effects of percent black and Hispanic, which I just threw in as controls, were much more substantial.  In states where there were few blacks and Hispanics, Trump generally did better than Romney had; in states with lots of black and Hispanics, he generally did worse.  The estimates were both negative and of similar size--if you combine them into a single "minority" proportion, the estimate is about -.13, and going from the states with the lowest percent minority to the highest (Texas and New Mexico) would reduce Trump's share by about .07.  

 Black voters are overwhelmingly Democratic everywhere; Hispanic voters are pretty heavily Democratic and Trump actually did a little better among them than Romney did, according to exit polls.  Black turnout was probably down from 2012, but Hispanic turnout was probably up.  So it seems likely that most of the shift resulted from changes among white voters. 

I will offer some thoughts on the meaning of this pattern in my next post.