Monday, October 30, 2023

From ignorance to knowledge and back again

 I didn't intend to post again this soon, but I read a story in the New York Times and saw this passage:  "In the United States, surveys point to declining civics understanding among adults [which leads] to weaker social discourse and faith in public institutions."  I don't think that there has been a general decline in civics understanding, or that lack of civics understanding in the public is a major source of the problems with our political culture, so I wanted to check their evidence.  

On clicking the link, I found it led to a legitimate survey sponsored by the Annenberg Center at the University of Pennsylvania, and the report was called "Americans’ Civics Knowledge Drops on First Amendment and Branches of Government."  So far, that seems to support the statement in the Times.  On reading further, I saw that the drop was relative to the previous year (2021), and it was dramatic--e. g., when asked what rights were guaranteed by the First Amendment, 20% named freedom of the press, down from 50% in 2021.  Going back further, 42% mentioned freedom of the press in 2020, and 14% in 2017.  So either we've had a big decline or a small increase in knowledge, depending on your starting year.  Something is wrong--you might get a large increase in knowledge on issues that suddenly come into the news (e. g., knowing where Ukraine is located), but this is something that people learn in school, if they learn it.  So you're not going to get large changes from year to year--you could get large changes over a long period of time, but they would involve the accumulation of small changes in the same direction. 

What explains the differences between the years?  With open-ended questions, the number who give responses is affected by the amount of encouragement they get from the interviewer--e. g., if someone says "I don't know," whether the interviewer says something like "just your best guess is OK."  This is particularly relevant to the First Amendment question, since multiple answers are possible.   Suppose someone answers "freedom of speech" and then pauses:   the interviewer could move to the next question, or could ask "anything else?" So my guess is that the exact instructions given to the interviewers changed over the years (or possibly the way they were paid in a way that changed their incentives--like hourly rate versus completed interviews).  The site has a report on sampling and weighting, but nothing on the exact instructions, so I can't check. 

You would think that someone involved in the project would realize that the numbers looked strange, and checked to see if the apparent changes in knowledge actually reflected some change in the survey procedures.  But they just presented them as straightforward changes in knowledge:  for example, the 2020 survey report was titled "Amid Pandemic and Protests, Civics Survey Finds Americans Know More of Their Rights."  I'm not saying that it's impossible that there were large year-to-year increases and declines in knowledge--just that it would be unusual enough to deserve close examination before saying that it happened.   


Sunday, October 29, 2023

Criminal tendencies, part 2

 In my last post, I said that perceptions of change in crime rates responded to actual conditions.  This post looks as party differences.  The proportion of Democrats and Republicans who think that crime is increasing in their area (independents are in between--I leave them out to make the figure more readable):


Under Biden, there's been a large partisan gap, with Republicans more likely to believe that crime has increased.  But a partisan difference existed before then--the average perception of an increase by administration:

                      Dem         Rep              Difference

GHW Bush    54%         46%                     -8%
Clinton           38%         41%                     +3%
GW Bush       45%         36%                     -9%
Obama           42%         53%                     +11%
Trump            40%         37%                     -3%
Biden             41%         70%                     +29%

The party difference was positive (meaning Republicans were more likely to see an increase) under all three Republican administrations and negative under all three Democratic administrations.  That is, people see things as better when their party is in power.  But the effect seems to be bigger for Republicans.  This is clear when you look at years when party control changed*:

                      Dem     Rep    Ind

2000-2001     -2%        -17%     -5%
2008-9           -1%        +13%    +7%
2016-7           +4%       -18%      -3%
2020-21         +3          +29%      +9%

In previous posts, I found that with  views about the future of the next generation Republicans were more affected by party control than Democrats were, but that with  ratings of current economic conditions Democrats and Republicans were about equally affected.  

If views are affected by both partisanship and actual conditions, that raises the question of whether the affect of conditions differs by party.  I couldn't get any definite results on that point.  

*There was no survey in 1993, 1994, or 1995, so it's not possible to judge the Bush-Clinton transition.  

Friday, October 27, 2023

Criminal tendencies

 People sometimes say that we are moving into a "post-truth" world where facts have less influence on what people think than they used to.  Paul Krugman had a column on perceptions of crime which didn't explicitly endorse this analysis, but seemed to lean in that direction.  He concluded "The good news is that . . . we seem to be heading back to the prepandemic normal of fairly low crime. The bad news is that the politics of fear can work, even if there isn’t much basis for those fears."   The column referred to a Gallup poll from October 2022 that found 56% of people thought that crime had increased in their area in the last year, which was the highest figure since they started asking the question in the early 1970s, even though the actual crime rate is substantially lower than it was in the 1970s and 1980s.


However, although the Gallup question speaks of more or less, some people volunteer that it's about the same.  In 1981, 54% said there was more crime in their area, 29% the same, and 8% less; in 2022, it was 56%, 14%, and 28%.  In general, the percent of "same" answers has been declining, so looking at changes in the average gives a different impression than looking at the "more" answers.

The figure shows the average, counting more as 1, less as -1, and same as 0.  There was a jump from 2020 to 2022, but the 2022 figure is still lower than the values for most of the 1970s and 1980s.  Also, perceptions seem to have responded to the decline in crime in the 1990s and early 2000s.  So if you consider the "same" answers, perceptions seem to have a better match to actual conditions.

I estimated a model in which perceptions depend on perceptions the last time the survey was taken and the change in the homicide rate over the last three years.*  The estimates are:

.029+(.90^gap)*LY+.053*X, where LY is perceptions in the previous survey, X is the change in the homicide rates and gap is the gap in years between the current survey and the previous one.  The estimated coefficient for X has a t-ratio of about 3.  

This is a pretty crude model, but it suggests that if we are returning to a period of lower crime, that perceptions can be expected to follow--or to put it another way, the "politics of fear" have less effect when there's less to fear.  However, Krugman also pointed to Gallup results indicating that Democratic and Republican perceptions of changes in crime rates have diverged recently.  I'll consider that issue in my next post.  

*I'm following the analysis in a post from 2014, in which I said I "used the last three years rather than the last year because I figured people probably didn't take the time frame all that literally."  That is, I just picked it because it seemed reasonable to me, not because I found it fit better than other possibilities.

[Data from the Roper Center for Public Opinion Research]


Tuesday, October 24, 2023

Strong feelings, part 3

 In a recent post, I said "Trump doesn't seem to have an exceptionally large number of enthusiastic supporters among the public . . . his continued strength in the party is mostly because of Republican elites' reluctance to challenge him..."  Andrew Gelman pointed to my discussion on his blog, and this post is partly inspired by the comments--not a point-by-point response, but expanding on and clarifying what I was trying to say.  

As of the 2020 election, Trump had a lot of enthusiastic supporters in the public--15.4% of respondents in the American National Election Studies survey rated him at 100 on a 0-100 scale, which is the second-best figure since the question was first asked in 1968.  But in 2016, only 6.4% did, which is below average.  So Trump didn't start with a lot of enthusiastic supporters--he acquired them when he was president.  How did he do that?  Here's a table showing the percent of 100 ratings for presidents in election and re-election campaigns.

                 first       re-election

Nixon              13%           15.5%
Carter              13.7%          7.8%
Reagan             5.5%          12%
GHW Bush    11.7%           4.7%
Clinton             4.9%          10.7%
GW Bush         5%             14.6%
Obama            11.6%          13.9%
Trump               6.4%          15.4%

Nixon and Obama had small gains--the other six had large changes--four up and two down.  Trump had the second biggest increase, behind George W. Bush.  

Here's the same kind of table showing the percent zero ratings.

             first       re-election

Nixon              2.6%            5.2%
Carter              4.8%            7.6%
Reagan             6.2 %           7.8%
GHW Bush      6.9%            7.9%
Clinton             4.9%            8.3%
GW Bush         4.2%          13.2%
Obama             6.7%           14.6%
Trump             31.3%          38.5%

It increased for all of them--Trump's increase was the third largest in absolute terms, behind George W. Bush and Obama.  

So overall, there's a tendency for extreme reactions to become more common during a presidency.     This tendency may have become stronger in the 21st century, which is reasonable given the general increase in polarization--supporters of the president's party rally around, while supporters of the other party rally against him.  

The ANES surveys are taken only once every four years.  Some other organizations ask "feeling thermometer" questions, but their not very common.  But to get a sense of the timing of the increase in strong support for Trump, we can use questions that distinguish between very and somewhat favorable.  The were pretty common during Trump's presidency--in fact, because of limitations of time and energy, I just recorded a selection.  


There's a fairly steady upward trend.  The two lowest values are from Spring 2016, when Trump was about to secure the Republican nomination and many Republicans were trying to make a stand against him.  I may record the rest of the data and try to do a more detailed analysis of the ups and downs later, but at this point the key thing is that it's an upward trend that seemed to last through his presidency. 

My last post showed that there's been a decline in Trump's very positive ratings since his presidency ended, but it's been pretty small.  As I said, I think that's because Republican elites have been reluctant to criticize him--I don't mean to denounce him as a threat to democracy (you couldn't expect that) but to say that he lost an election, and lost by a pretty big margin to an underwhelming opponent.  Why?  One reason is simply the belief that he has an unshakeable base of personal support, so you can't afford to antagonize him.  Another is that his charges of a stolen election, although they didn't convince many people, diverted Republicans into talking about "irregularities"--were the Covid-related changes in election procedures adopted improperly?  Were they intended to help the Democrats?  Were social media companies biased?  On these points, many or most Republicans were inclined to agree with him.  (That seems to be one of Trump's general strengths--the ability to bring something up from out of left field and get people talking about it.)  So the normal debate about the reasons for defeat that usually starts right after the election was delayed, and then delayed again by January 6 and the impeachment.  Since the debate hadn't taken place, Trump's support held up, and since his support held up, people were reluctant to raise the issue.    

[Data from the Roper Center for Public Opinion Research]

Saturday, October 14, 2023

Strong feelings, part 2

My last post was about ratings of presidential candidates at the extreme values on the ANES "feeling thermometer." Donald Trump set a record for extremely low (0) ratings in 2016, and broke it in 2020.  In 2016, he had an average level of 100 ratings--in 2020 that rose to the second-highest since they started asking the question in 1968.  The same question has been asked a few times since the election in Pew surveys.*  The percent giving 0 and 100 ratings:


The first point is the ANES survey, which was taken just before the election, and the second was a Pew survey taken shortly after.  Both showed about 15% rating Trump at 100, but that fell to 10% in March 2021 and remained there in July.   Many people accept Trump's claims has an unusually large core of enthusiastic supporters who will stick with him through anything--"I could shoot someone on Fifth Avenue..."--but in fact there have been substantial ups and downs in the percent who rate him at 100.   

Another point that struck me in the ANES data is is that there was little variation in zero ratings through 2000, with the exception of George McGovern in 1972, but there was a jump with George W. Bush in 2004.  That was a sign of things to come, so I wanted to look more closely at Bush's negative ratings.  The "feeling thermometer" question was only asked a few times, but there were frequent questions asking if your view of him was very favorable, somewhat favorable, somewhat unfavorable, or very unfavorable.  In fact, I there were enough so that I didn't use all of them, just a selection.  The percent who chose "very unfavorable":
They were pretty steady from May 2000 until April 2003, but very unfavorable ratings rose to 25% by February 2004 and then stayed high, before rising again in 2008.  So the Iraq war seems to have been the key.  It's not surprising that it had an effect, but it is noteworthy that the controversy over the 2000 election apparently didn't.  The 2004 election also didn't make much difference, contrary to what is sometimes said--very unfavorable ratings fell from 34% in October 2004 to 25% in January 2005.  It's also striking that Bush had a large number of very unfavorable ratings even before the financial crisis--44% in 2008, when we were in only a mild recession.  Finally, his very unfavorable ratings dropped after he left office.  I'm not sure if that's a general tendency with former presidents, but it is different from Trump, who just had a small decline in zero ratings.  


* Pew also asked question in 2022, but the data haven't been released and they only report the results in ranges.

[Data from the Roper Center for Public Opinion Research]

Saturday, October 7, 2023

Strong feelings

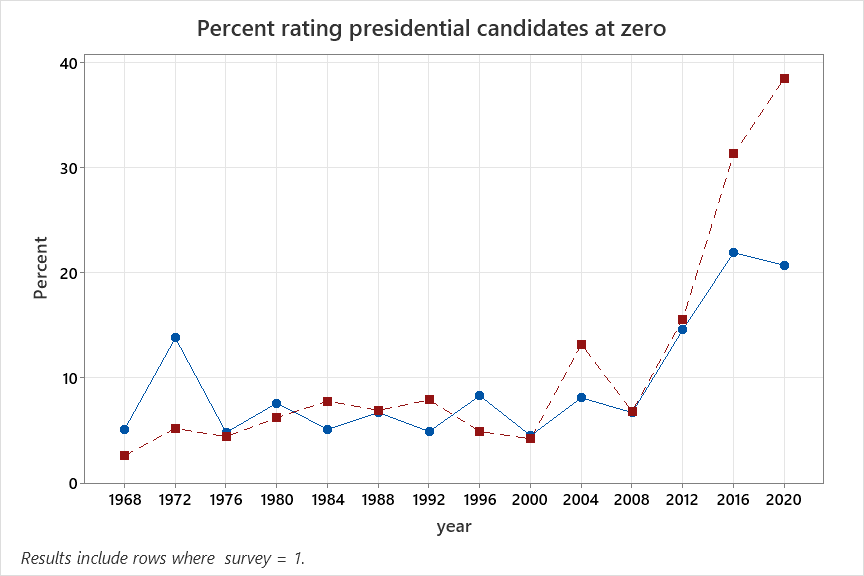
 A couple of months ago, some people were saying that Donald Trump's favorability ratings rose every time he was indicted (I've forgotten specific references, but I know I saw some).  The idea seemed to be that some supporters had been drifting away until their sympathies were reawakened by what they regarded as persecution by the "deep state".   Closer examination has shown that this isn't true, that his favorability ratings actually declined slightly after the indictments.  But at the time, it occurred to me that  the degree of favorability might be more subject to change--shifting from "strongly favorable" to "somewhat favorable" is easier than shifting from favorable to unfavorable--and that the degree of favorability will matter in the race for the nomination.  On searching, I found there aren't many questions that ask for degree of favorability, and that breakdowns by party weren't available for most of them.  However, the search wasn't useless, because it reminded me of the American National Election Studies "feeling thermometers" for presidential candidates, which ask people to rate the candidates on a scale of zero to 100.   Here is the percent rating the major party candidates at zero:


With the exception of George McGovern in 1972, everyone was below 10% until 2004, when 13% rated GW Bush at zero.  In 2008, things were back to normal, with both Obama and McCain at around 7%, but starting in 2012, zero ratings increased sharply.  


The next figure shows the percent rating each candidate at 100.  There is a lot of variation from one election to the next, but no trend.  In 2016, 6.4% rated Trump at 100, which is a little lower than average (and the same as Hillary Clinton).  He rose to 15.4% in 2020, which is the second highest ever, just behind Richard Nixon in 1972.  But several others have been close, most recently Obama in 2012 and Bush in 2004, and it's not unusual for presidents to have a large increase in their first term (GW Bush, Clinton, and Reagan had similar gains).   That is, Trump doesn't seem to have an exceptionally large number of enthusiastic supporters among the public (also see this post).  I think his continued strength in the party is mostly the result of Republican elites' reluctance to challenge him, which is a mixture of genuine support and exaggerated ideas about his strength among Republican voters.  

Saturday, September 23, 2023

Tit for tat?

 This is a follow-up to my post arguing that American political institutions, which were traditionally held to reduce polarization (and probably did), promote it given the conditions that prevail today (viz., parties that are  distinguished by ideology).  A new book by Steven Levitsky and Daniel Ziblatt that makes the same general argument has been getting attention, so I thought I should say how my view differs from theirs.  Levitsky and Ziblatt say that the main problem is institutions that work against majority rule, like the Senate, the Electoral College, and gerrymandered congressional districts.  As Michelle Goldberg summarizes it "The Constitution’s countermajoritarian provisions, combined with profound geographic polarization, have locked us into a crisis of minority rule."  However, in recent years the institutions that are more majoritarian have been more of a problem.  For example, most of the Republican members of the House of Representatives voted against "certifying" the 2020 election, but only a few of the Republican members of the Senate did.  It's the House, not the Senate, that has tried to use the debt ceiling as a political weapon.  Judges, including judges appointed by Trump, almost unanimously rejected Trump's attempts to overturn the results of the 2020 election.  Since the election, Republican-controlled state legislatures have made efforts to change electoral rules to benefit Republicans.  I think that the difference between the Senate and the House and state legislatures arises because Senators have a higher profile--someone who goes against the party may be able to survive, and even to benefit.  But Representatives and members of the state legislature are unknown to many of their constituents.  So the logic of trying to appeal to the "median voter" doesn't hold for them--the median voter probably won't even know what they've done, and will treat them like any other Democrat or Republican.  But party activists will know, and may support a primary challenge or withhold financial support.  

I also want to elaborate on my point about the complexity of the American political system, especially the electoral system.  That provides opportunities to take advantage of the system--figuring out some angle you can use to get your way.  Of course, if you do that, the other party is likely to retaliate, and the possibility of retaliation can be an effective deterrent.   But the complexity of the system also means that there's room for disagreement about whether an action is out of bounds, or how severe an infraction it is.  So the other side commits some offense, you retaliate in what you regard as a reasonable and proportionate manner, and then they are indignant about what they regard as a grossly excessive reaction.  It's even possible to take offense at things that haven't happened, but that you think might happen.  For example, a Washington Post column by Jason Willick discussing the argument that Trump is ineligible to run for president:  "What is sure to be a well-funded and well-coordinated campaign to disqualify Trump from office has begun.... Champions of 'automatic' disqualification have one pragmatic objective in mind: Eliminating Trump from U.S. politics. So what if they turn the 14th Amendment’s Section 3 into a Red Scare instrument in the process? ...  populists will someday have another chance in government. At that point, liberals might come to regret having legitimated the 14th Amendment as a quasi-authoritarian tool for purging political opposition."  During the 2020 election campaign, the Claremont Review talked about how Democrats would try to overturn a Trump victory.  And if the hypothetical action you became indignant about doesn't happen, you don't have to conclude that you were wrong--you can conclude that they surely would have done it if we hadn't called them out.  

 And finally, some data.  In 2016, a CNN/ORC poll asked people if they thought Trump would concede if he lost the election and then asked the same question about Hillary Clinton.  About 65% said that Trump would not concede, and 25% said Clinton would not.   Answers were strongly related to who you favored--Trump supporters were more likely to say that he would concede and less likely to say that Clinton would, and Clinton supporters were more likely to say that she would concede and Trump wouldn't.  But that wasn't the only thing that made a difference:  more educated people were more likely to say that both would concede.  The percent expecting each to concede, by candidate preference and education:

Not college grad                  Trump                Clinton

Trump supporter                     52%                    57%
Clinton supporter                    19%                    92%
Neither/DK                              22%                    63%

College grad                        Trump                Clinton

Trump supporter                     67%                    70%
Clinton supporter                    26%                    95%
Neither/DK                              30%                    77%

Similar questions were asked in 2020, with similar overall results, although I can't get the breakdowns.  The point is that some Trump supporters could justify his refusal to concede by a belief that the Democrat wouldn't have conceded either.  

[Data from the Roper Center for Public Opinion Research]