A few weeks ago, the Pew Research Center released a survey about views of the parties and partisanship (I got the reference from a piece by Philip Bump in the Washington Post). The survey contained questions asking them to rate members of the other party against other Americans on the following traits: open-minded/closed-minded, patriotic/unpatriotic, moral/immoral, hard-working/lazy, and intelligent/unintelligent. Democrats were somewhat more likely to see Republicans as closed-minded than vice-versa; Republicans were substantially more likely to see Democrats as unpatriotic and somewhat more likely to see them as immoral. In the sample, Democrats were slightly more likely to see Republicans as unintelligent, although the differences are probably not statistically significant. This all fits with what seem to be the general images of the parties.
The more surprising thing is that there is a big difference in hard-working/lazy. 46% of Republicans see Democrats as lazier than other Americans, while only 20% of Democrats see Republicans as lazier than other Americans. This is the biggest gap except for "patriotic." I would have expected that relatively few people would rate the other party as "lazy"--it seems like admitting that your opponents are just as hard-working as everyone else is an easy concession to make. That may be the case for Democrats, but apparently not for Republicans. I've had a few posts suggesting that conservatives are more likely to rate hard work as a more important factor in getting ahead, and maybe this is part of the answer--Republicans tend to think that Democrats want the government to help them with problems that they could solve themselves if they tried.
Friday, October 25, 2019

Tuesday, October 15, 2019
How many Democrats?
A Fox News poll last week found that 51% of the respondents said that Donald Trump should be impeached and removed from office and another 4% said he should be impeached but not removed. On Sunday, Donald Trump tweeted "The Fox Impeachment poll has turned out to be incorrect. This was
announced on Friday. Despite this, the Corrupt New York Times used this
poll in one of its stories, no mention...of the correction which they knew about full well!"
He cited a story in the New York Post with the title “Fox News Pollster Braun Research Misrepresented Impeachment Poll: Analysis” The problem, according to the Post, was that 48% of the Fox sample said they were Democrats, "but the actual breakdown of party affiliation is 31% Democrat, 29% Republican and 38% independent, according to Gallup." If you weighted by the "actual" distribution of party affiliation, support for impeachment was only about 45%.
So how many Democrats are there? The figure the Post gives is from the question, "In politics, as of today, do you consider yourself a Republican, a Democrat or an independent?" However, most survey organizations follow up on the initial question by asking people who don't choose Democrat or Republican whether they lean towards one of the parties, and when they report the opinions of Democrats or Republicans they include the "leaners". That was what the Fox News poll did. Their first round got 40% Democrats, 33% Republicans, 27% independents. On the follow up, 8% of the total sample said they leaned to the Democrats, 7% to the Republicans.
The 40/33/27 distribution in the first round of the Fox poll is still pretty different from the 31/29/38 in Gallup. Unfortunately Fox didn't report the party question they used, but in the most recent Fox News survey in the Roper Center, it was "When you think about politics, do you think of yourself as a Democrat or a Republican?" That is, it didn't offer "independent" as an option--people had to volunteer it. It makes sense that the number of reported independents would be lower with that question.
So the NY Post "analysis" just reflected ignorance about how surveys measure party affiliation. The ratio of Democrats to Republicans is somewhat different in the Fox and Gallup polls, but the difference is small enough to easily be the result of chance in a sample of the usual size. Gallup's most recent estimate, based on averages of surveys in July-Sept 2019, is 47% Democrats and 42% Republicans (including "leaners"), not much different from the 48% and 40% in the Fox poll. Gallup reports that "the current Democratic advantage is among the larger ones for the party over the past two decades."
So 48% Democrats, and by implication, 51% support for impeaching and removing Trump from office sound about right.
He cited a story in the New York Post with the title “Fox News Pollster Braun Research Misrepresented Impeachment Poll: Analysis” The problem, according to the Post, was that 48% of the Fox sample said they were Democrats, "but the actual breakdown of party affiliation is 31% Democrat, 29% Republican and 38% independent, according to Gallup." If you weighted by the "actual" distribution of party affiliation, support for impeachment was only about 45%.
So how many Democrats are there? The figure the Post gives is from the question, "In politics, as of today, do you consider yourself a Republican, a Democrat or an independent?" However, most survey organizations follow up on the initial question by asking people who don't choose Democrat or Republican whether they lean towards one of the parties, and when they report the opinions of Democrats or Republicans they include the "leaners". That was what the Fox News poll did. Their first round got 40% Democrats, 33% Republicans, 27% independents. On the follow up, 8% of the total sample said they leaned to the Democrats, 7% to the Republicans.
The 40/33/27 distribution in the first round of the Fox poll is still pretty different from the 31/29/38 in Gallup. Unfortunately Fox didn't report the party question they used, but in the most recent Fox News survey in the Roper Center, it was "When you think about politics, do you think of yourself as a Democrat or a Republican?" That is, it didn't offer "independent" as an option--people had to volunteer it. It makes sense that the number of reported independents would be lower with that question.
So the NY Post "analysis" just reflected ignorance about how surveys measure party affiliation. The ratio of Democrats to Republicans is somewhat different in the Fox and Gallup polls, but the difference is small enough to easily be the result of chance in a sample of the usual size. Gallup's most recent estimate, based on averages of surveys in July-Sept 2019, is 47% Democrats and 42% Republicans (including "leaners"), not much different from the 48% and 40% in the Fox poll. Gallup reports that "the current Democratic advantage is among the larger ones for the party over the past two decades."
So 48% Democrats, and by implication, 51% support for impeaching and removing Trump from office sound about right.
Saturday, October 12, 2019
Education, redistribution, and markets
I have had several posts (this, this, and this) about change in the effect of education on opinions about redistribution and government obligation to help the poor: after controlling for income, education used to go opposition to redistribution, but now it makes little difference. But education still seems to make a difference in general attitudes about markets. Educated people are more likely to support free trade rather than the protection of domestic industry. More generally, they are less sympathetic to at least some kinds of direct regulation.
In July 2008, a Gallup/USA Today poll asked "Thinking now about some of the solutions offered to address the energy situation in the United States, please say whether you would be more likely or less likely to vote for a candidate who supported...establishing price controls on gasoline?" "More likely" got 75% among people with no college, 55% among those with some college, 50 percent among those with a college degree, and 43% among those with graduate education. Education still made a difference after controlling for income, and in fact made more difference than income, if you go by the standardized regression coefficients. The same survey asked about a number of other possible actions--the education effect for this item was the strongest of all.
Why would more educated people be less in favor of price controls? One possibility is the direct influence of what they studied. However, my guess is that most college graduates didn't take a course in economics, and most don't recall many specific points from their courses. So I think it's more likely to reflect a general way of thinking--more educated people are less likely to believe that simply forbidding people to do something will be effective.
So even if more and less educated people are now similar in their general support for redistribution, there are some differences in the types of policies they support to achieve it, and that difference may create problems for parties of the left.
Since it's been a relatively long gap between posts, I'll add a bonus to this one. In most surveys, the highest income category is something like $100,000 and up, so you can't make fine distinctions at the high end. But this one included more detailed categories, of which the highest was $500,000+. When asked about who they thought they would vote for in November 2008, people in the top group went for McCain by 9-2. The income groups below that were pretty evenly split. The difference could have been just the result of chance (the p-value for the hypothesis of no difference among the highest income groups was something like .07), but it is intriguing. If other Gallup/USA Today surveys from the same time used the same income groups, you could combined them to see if it holds up.
[Data from the Roper Center for Public Opinion Research]
In July 2008, a Gallup/USA Today poll asked "Thinking now about some of the solutions offered to address the energy situation in the United States, please say whether you would be more likely or less likely to vote for a candidate who supported...establishing price controls on gasoline?" "More likely" got 75% among people with no college, 55% among those with some college, 50 percent among those with a college degree, and 43% among those with graduate education. Education still made a difference after controlling for income, and in fact made more difference than income, if you go by the standardized regression coefficients. The same survey asked about a number of other possible actions--the education effect for this item was the strongest of all.
Why would more educated people be less in favor of price controls? One possibility is the direct influence of what they studied. However, my guess is that most college graduates didn't take a course in economics, and most don't recall many specific points from their courses. So I think it's more likely to reflect a general way of thinking--more educated people are less likely to believe that simply forbidding people to do something will be effective.
So even if more and less educated people are now similar in their general support for redistribution, there are some differences in the types of policies they support to achieve it, and that difference may create problems for parties of the left.
Since it's been a relatively long gap between posts, I'll add a bonus to this one. In most surveys, the highest income category is something like $100,000 and up, so you can't make fine distinctions at the high end. But this one included more detailed categories, of which the highest was $500,000+. When asked about who they thought they would vote for in November 2008, people in the top group went for McCain by 9-2. The income groups below that were pretty evenly split. The difference could have been just the result of chance (the p-value for the hypothesis of no difference among the highest income groups was something like .07), but it is intriguing. If other Gallup/USA Today surveys from the same time used the same income groups, you could combined them to see if it holds up.
[Data from the Roper Center for Public Opinion Research]
Thursday, October 3, 2019
I had some dreams
Many analyses of the 2016 election hold that Trump voters, at least the working class ones, were motivated by dissatisfaction with their lives stemming from declining standards of living, the disdain of coastal elites, or some combination. On the other hand, a traditional view is that general dissatisfaction leads people to support the left, since conservatism is associated with the status quo and liberalism with change.
This issue was brought to mind by an essay entitled "The spiritual crisis of the modern economy", which was published in December 2016, but which I just saw today. When reading it, I recalled that there was a survey question asked in 1999: "Think about what you expected for the future when you were of high school age. Generally, have you accomplished more than you expected to by now, less than you expected, or about as much as you expected?" 41% said more, 24% less, and 34% about as much. Here are some associations:
Demographics:
Gender--no clear difference
Ethnicity--blacks less satisfied, Latinos and whites about the same
Age--older people substantially more satisfied
Education--little or no difference through college degree; grad degrees maybe a little more satisfied
Income--higher income people more satisfied
Marital status--married and widowed people more satisfied; never married least satisfied
Urban vs. rural--little or no difference
Politics:
Self-rated ideology: conservatives more satisfied
Vote: Dole voters more satisfied than Clinton voters, Perot voters in the middle; non-voters substantially less satisfied
I find it interesting that education doesn't make much difference (and to the extent it does, it's just because it leads to higher income). Critiques of "meritocracy," like the one I mentioned above, often suggest that a focus on education makes people without a college degree (or in some accounts, people without an "elite" college degree) feel like failures. Of course, things can change over 20 years, but as of 1999 that apparently wasn't the case.
[Data from the Roper Center for Public Opinion Research]
This issue was brought to mind by an essay entitled "The spiritual crisis of the modern economy", which was published in December 2016, but which I just saw today. When reading it, I recalled that there was a survey question asked in 1999: "Think about what you expected for the future when you were of high school age. Generally, have you accomplished more than you expected to by now, less than you expected, or about as much as you expected?" 41% said more, 24% less, and 34% about as much. Here are some associations:
Demographics:
Gender--no clear difference
Ethnicity--blacks less satisfied, Latinos and whites about the same
Age--older people substantially more satisfied
Education--little or no difference through college degree; grad degrees maybe a little more satisfied
Income--higher income people more satisfied
Marital status--married and widowed people more satisfied; never married least satisfied
Urban vs. rural--little or no difference
Politics:
Self-rated ideology: conservatives more satisfied
Vote: Dole voters more satisfied than Clinton voters, Perot voters in the middle; non-voters substantially less satisfied
I find it interesting that education doesn't make much difference (and to the extent it does, it's just because it leads to higher income). Critiques of "meritocracy," like the one I mentioned above, often suggest that a focus on education makes people without a college degree (or in some accounts, people without an "elite" college degree) feel like failures. Of course, things can change over 20 years, but as of 1999 that apparently wasn't the case.
[Data from the Roper Center for Public Opinion Research]
Thursday, September 26, 2019
Has anything changed?
The General Social Survey has a question beginning "Some people think that the government in Washington should do everything possible to improve the standard of living of all poor Americans; they are at point 1 on this card. Other people think it is not the government's responsibility, and that each person should take care of himself; they are at point 5," and asking them to place themselves. The figure shows the estimated effects of (log) income and education on opinions for each year that the question was asked.

Positive numbers mean that the effects are in a conservative direction--"not the government's responsibility." The effects of income are consistently in a conservative direction, and don't show any trend. The effects of education are initially in a conservative direction, but go towards zero and negative in 2014, 2016, and 2018. That is, more educated people are more liberal on this question than people with the same income but less education.
I've had a number of other posts about changes in the effects of education on opinions about redistribution, most recently this and this. They all suggest education used to go with opposition to egalitarian redistribution, but no longer does. (Income still does, and the magnitude of the difference after controlling for education hasn't changed much).
This point doesn't seem to be widely recognized--most observers seem to assume that "elites" of all kinds are opposed to redistribution. An example is a paper that appeared in Science by Raymond Fisman, Pamela Jakiela, Shachar Kariv, and Daniel Markovits called "The Distributional Preferences of an Elite." The elite was Yale Law students, and according to the abstract, they displayed "selfishness" and were "less fair-minded" than the average person. The paper began by speaking of the "sense of entitlement" of "the American elite," with a footnote that spoke of "the phenomenon of growing elite entitlement." The research itself was interesting, but the packaging was misleading. It didn't deal with preferences involving the overall distribution of income and wealth, but with behavior in a low-stakes online exercise where you chose how to divide a sum between yourself and an anonymous "partner." Basically, they found that the Yale Law students played the game differently than average people--they had more concern with their own gains and less with an even split between participants. OK, but that's pretty far from issues like whether to raise taxes on people with high incomes. A recent survey of technology entrepreneurs found that they were about as favorable to redistribution as Democrats in the general population (e. g. 76% favored raising taxes on people who earned over $250,000 per year), and from my experience of universities, I think that if Fisman et al. had asked similar questions of their participants, they would have found a lot of support for redistribution.
If some elites, especially educational elites, have become more sympathetic to redistribution, why hasn't the change received more attention? One reason is the natural appeal of the principle that opinions reflect straightforward self-interest. Another possibility is what I have called an "anti-elitist mood," in which people are reluctant to say anything positive about "elites." This mood seems to be especially strong among people who are part of an elite themselves.

Positive numbers mean that the effects are in a conservative direction--"not the government's responsibility." The effects of income are consistently in a conservative direction, and don't show any trend. The effects of education are initially in a conservative direction, but go towards zero and negative in 2014, 2016, and 2018. That is, more educated people are more liberal on this question than people with the same income but less education.
I've had a number of other posts about changes in the effects of education on opinions about redistribution, most recently this and this. They all suggest education used to go with opposition to egalitarian redistribution, but no longer does. (Income still does, and the magnitude of the difference after controlling for education hasn't changed much).
This point doesn't seem to be widely recognized--most observers seem to assume that "elites" of all kinds are opposed to redistribution. An example is a paper that appeared in Science by Raymond Fisman, Pamela Jakiela, Shachar Kariv, and Daniel Markovits called "The Distributional Preferences of an Elite." The elite was Yale Law students, and according to the abstract, they displayed "selfishness" and were "less fair-minded" than the average person. The paper began by speaking of the "sense of entitlement" of "the American elite," with a footnote that spoke of "the phenomenon of growing elite entitlement." The research itself was interesting, but the packaging was misleading. It didn't deal with preferences involving the overall distribution of income and wealth, but with behavior in a low-stakes online exercise where you chose how to divide a sum between yourself and an anonymous "partner." Basically, they found that the Yale Law students played the game differently than average people--they had more concern with their own gains and less with an even split between participants. OK, but that's pretty far from issues like whether to raise taxes on people with high incomes. A recent survey of technology entrepreneurs found that they were about as favorable to redistribution as Democrats in the general population (e. g. 76% favored raising taxes on people who earned over $250,000 per year), and from my experience of universities, I think that if Fisman et al. had asked similar questions of their participants, they would have found a lot of support for redistribution.
If some elites, especially educational elites, have become more sympathetic to redistribution, why hasn't the change received more attention? One reason is the natural appeal of the principle that opinions reflect straightforward self-interest. Another possibility is what I have called an "anti-elitist mood," in which people are reluctant to say anything positive about "elites." This mood seems to be especially strong among people who are part of an elite themselves.
Tuesday, September 17, 2019
Twenty-four more years
In a previous post, I mentioned that I had once compiled data on education, occupation, and vote in American presidential elections from 1936 to 1992, using a combination of Gallup polls (1936-68) and the GSS (1968-92). I showed changes in the relationship between college education and major party presidential vote. I have finally gotten around to updating this with the GSS data through 2016. Here is the estimated effect of college education (0=no college; 1=some college; 2=college degree) on Democratic vs. Republican voting among non-blacks, 1936-2016.

There is some variation from one election to the next--the pro-Democratic effect in 2016 election was higher than expected, but the most exceptional election was 1972, which set a record that was not broken until 2016. However, the dominant thing is a trend that seems to have started at the beginning (the correlation with a time trend is about .85). I would have guessed that the trend began or at least accelerated in the 1960s, but there's no sign of that. That is, the relative shift of educated people towards the Democrats is a gradual process that was underway long before people started noticing it, and shows no signs of stopping.
How big are the effects? If you fit a linear trend for the education effect to smooth out the short-term variations, in an election where 50% of high school graduates voted Democratic, the predicted Democratic vote among college graduates goes from 34% in 1936 to 61% in 2016.
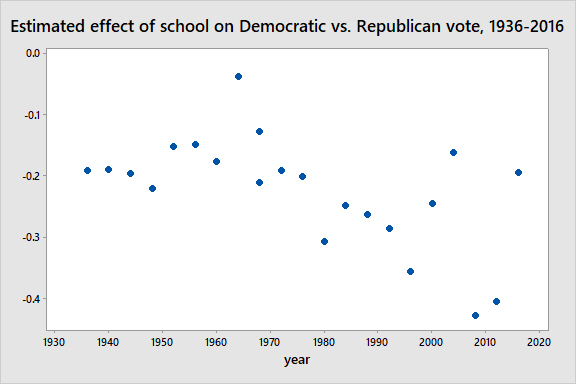
The numbers above are not a contrast with all people without college education--they control for the changing effects of primary/secondary education (no formal education, elementary, grades 7-8, attended high school, high school diploma). Those estimates are shown in the next figure. Note that they are consistently in a pro-Republican direction, and have become more pro-Republican since the 1960s. (This might be because the people with less than a high school diploma are increasingly likely to be immigrants, who tend to vote Democratic).

So what needs to be explained is apparently not a change in the effects of education, but a change in the effects of higher education. Why has this happened? In a paper published in 2002, I offered an idea: "growth in affluence and the division of labor has produced occupational niches for educated people who are critical of the status quo." Previously, people might have developed "radical" ideas in college, but tended to abandon them after they had to earn a living. Now, such people can find occupations where their ideas are accepted or even dominant. I don't know if my explanation is the whole story, or even part of the story, but I was at least looking in the right direction: the change in the effect of higher education seems to be a gradual shift, not closely tied to specific political events.
[Data from the Roper Center for Public Opinion Research and the General Social Survey]
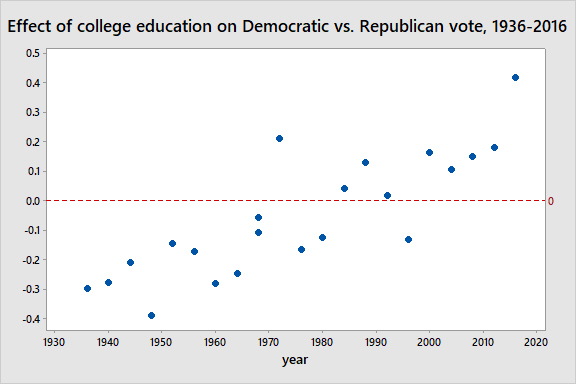
There is some variation from one election to the next--the pro-Democratic effect in 2016 election was higher than expected, but the most exceptional election was 1972, which set a record that was not broken until 2016. However, the dominant thing is a trend that seems to have started at the beginning (the correlation with a time trend is about .85). I would have guessed that the trend began or at least accelerated in the 1960s, but there's no sign of that. That is, the relative shift of educated people towards the Democrats is a gradual process that was underway long before people started noticing it, and shows no signs of stopping.
How big are the effects? If you fit a linear trend for the education effect to smooth out the short-term variations, in an election where 50% of high school graduates voted Democratic, the predicted Democratic vote among college graduates goes from 34% in 1936 to 61% in 2016.
The numbers above are not a contrast with all people without college education--they control for the changing effects of primary/secondary education (no formal education, elementary, grades 7-8, attended high school, high school diploma). Those estimates are shown in the next figure. Note that they are consistently in a pro-Republican direction, and have become more pro-Republican since the 1960s. (This might be because the people with less than a high school diploma are increasingly likely to be immigrants, who tend to vote Democratic).
[Data from the Roper Center for Public Opinion Research and the General Social Survey]
Tuesday, September 10, 2019
Before I forget
I saw a reference to a survey question asked by the Gallup Poll in 1963: "On the whole, would you say that you are satisfied or dissatisfied with the honesty and standards of behavior of people in this country today?" 34% were satisfied, 58% dissatisfied. The question was repeated a number of times, most recently in 1999. I think that I've seen that question before. What I hadn't known was that it was asked in several other nations. The percent dissatisfied:
Norway 20%
France 39%
UK 47%
W. Germany 51%
USA 58%
[Source: Robert Lane, Political Thinking and Consciousness, p. 216]
Norway 20%
France 39%
UK 47%
W. Germany 51%
USA 58%
[Source: Robert Lane, Political Thinking and Consciousness, p. 216]
Subscribe to:
Posts (Atom)