Monday, July 28, 2025

On the eve

 In 1965, there was a Harris poll of college students.  One of the questions involved showing people a list of authors and asking if any were among your favorites.  The authors, listed in order of number choosing them, were William Faulkner, JD Salinger, Ian Fleming, James Baldwin, Albert Camus, Jean-Paul Sartre, Edward Albee, Henry Miller, John Updike, CP Snow, Saul Bellow, Norman Mailer, Philip Roth, Jean Genet, William Burroughs, John Cheever, and Doris Lessing.  Baldwin was known for his writings on race and the civil rights movement, and Fleming was a genre novelist (James Bond)--the others could be called "literary" authors.*  I made an index of the number of literary authors that students named as favorites (capped at 4)--about 30% scored 0, 30% 1, 24% 2, 8% 3, and 8% 4 or more.  The survey was mostly about college affairs, but there were a number of political questions, and I looked at their association with score on the literary authors index and with picking Fleming as a favorite.  Baldwin took clear positions on some of the issues, so picking him was an obvious signal of political views--I was interested in whether general taste in literature was associated with political views.

The results:

Vote (or preference) in 1964 election: 
   literary authors:  more likely to support Johnson
   Fleming:  no  clear difference

Party ID:
   literary authors:  more likely to be Democrats or Independents
   Fleming:  no clear difference

Have your views on politics changed a good deal, some, or only a little in college?
    literary authors:  more likely to say a good deal or some
    Fleming:  no clear difference

Vietnam (carry war to North Vietnam; negotiate and get out; hold the line)
   literary authors:  more dovish
   Fleming:  more hawkish    

Should "girl students" be able to obtain contraceptives at the school infirmary?
   literary authors:  more likely to say yes
   Fleming:  no clear difference

Should laws on abortion be relaxed, tightened, or kept the same?
   literary authors:  more likely to say relaxed
   Fleming:  maybe some preference for tightened or kept the same

Approve of Mississippi Freedom Summer
    literary authors:   more likely to approve
    Fleming:  less likely 

Approve of Negro and white students living in the same dormitories:
    literary authors:  no clear difference
    Fleming:  no clear difference

Approve of Negro and white students eating in the same cafeterias:
    literary authors:  no clear difference
    Fleming:  no clear difference

For the preceding two questions, overwhelming majorities approved.  

Approve of Negro and white students belonging to the same social clubs
    literary authors:  no clear difference
    Fleming:  less likely to approve

Overall, there was strong approval, but 21% of students who chose Fleming as a favorite author disapproved, compared to only 9% of those who didn't choose him.

Approve of Negro and white students dating each other:
    literary authors:  more likely to approve
    Fleming: less likely to approve

Approve of "intermarriage between the races"
    literary authors:  more likely to approve
    Fleming:  less likely to approve

There was a pretty consistent tendency for people who liked more literary authors to take liberal positions.  With Fleming, it was less consistent, but when it made a difference, choosing him as a favorite was associated with more conservative positions.  Why?  There's a saying (usually attributed to Robert F. Kennedy, Sr., but apparently George Bernard Shaw said it first):  "some men see things as they are and ask why; I dream of things that never were and ask why not?"  This leaves out a third group (and probably the largest one):  those who see things as they are and say "that's just the way it is."  That is, people who are curious about things are more likely to be critical; conversely, people who just want to be more entertained are more likely to favor keeping things as they are.**  

The more general point is that the association between intellectualism and left-of-center political views is deeply rooted.  

*Sartre also wrote on politics, but I think that at that point he was better known for his novels and plays.

**See also this post.  

Thursday, July 24, 2025

I couldn't resist

 As I mentioned in my last post, I have a number of new posts planned (dealing with confidence in institutions and the relation between college education and politics), but this isn't one of them.  A few days ago, a New York Times op-ed by Jonathan Rauch and Peter Wehner mentioned a Gallup question that goes back to the 1940s:  "looking ahead for the next few years, which political party do you think will do a better job of keeping the country prosperous — the Republican Party or the Democratic Party?"  and I couldn't resist taking a closer look.  The difference between percent saying Democrats and percent saying Republicans:


Rauch and Wehner say "In the post-World War II period, Democrats — still remembered for ending the Great Depression — held a seemingly impregnable prosperity advantage, forcing Republicans to fight every national election uphill."  That had been my impression too, but I'm not sure that the figure bears it out.  In the 1940s and 1950s, the parties were about even.  The Democrats pulled ahead after the recession of 1958, and built their lead in the Kennedy-Johnson administration, but those changes could plausibly be explained as a reaction to short-term economic conditions.  On the other hand, the Republicans never managed to get more than a small lead, so maybe the public did have a tendency to favor the Democrats after taking account of current conditions.  But since the late 1970s, it's been close, as Rauch and Wehner point out.  Also, there seems to have been less variation over time:    between 1964 and 1968, it went from +41 for the Democrats to +2, and between 1972 and 1974 from -5 to +30.  In the last 25 years, the range has been from -14 to +20).    That's probably a reflection of the growing strength of partisanship--people are more likely to say that their party is better, regardless of current conditions.  A possibly related point is that the number of people who name a party (rather than saying that they're both the same or that they don't know which would be better) has increased:  


That may be influenced by changes in interviewing techniques, but the shift has been so large and steady that it seems likely that there's an underlying change in propensity to choose a party--that is, a decline in the number of real independents.  Finally, in recent years, Republicans have had an advantage:  they've led in 13 of the last 15 surveys.  

[Some data from the Roper Center for Public Opinion Research]


Friday, July 18, 2025

Where was I?

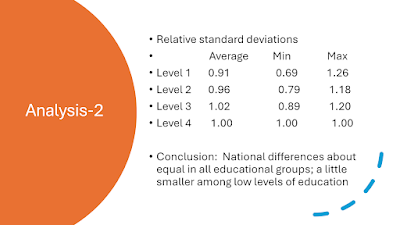
It has been a long time since my last post.  I've been away for the past couple of weeks, at the International Sociological Association Forum of Sociology and then vacationing.  I have a number of posts planned, but also an accumulation of other things that need to get done before I can work on them, so for anyone who is eagerly awaiting another post, here are the slides for my presentation:


Friday, June 27, 2025

College electors, part 3

 I had two previous posts on voting preferences among college students in the 1940s-70s.  This post will look at faculty at two elite universities, Yale and Princeton.   Polls of faculty were less common than polls of students, but were taken in some elections.   In 1948, a poll of Princeton faculty found 47% for Thomas Dewey, 31% for Harry Truman, 16% for Norman Thomas (Socialist), 3% for Henry Wallace (Progressive), and less than 1% (1 out of 220) for Strom Thurmond.  The biggest difference from the national vote was with Thomas, who got only 0.3% in the election.*  I think that some of his support in the poll was sentimental (he was a Princeton graduate) and would have gone to Truman in a real election.  But either way, Princeton faculty were well to the left of the students, who went 70% for Dewey and 10% for Thurmond.  Dewey did better in the sciences and engineering.  

In 1952, 57% of Yale faculty favored Adlai Stevenson and 41% went for Dwight Eisenhower.  Engineering went for Eisenhower by a 3:1 margin, but all of the other schools went for Stevenson, with the Law and Divinity schools especially one-sided (they didn't break it down by department within Arts and Sciences).  The survey also asked about preference in three Senate races, two in Connecticut (one was to fill a vacancy) and one in Wisconsin, where Joe McCarthy was running for re-election.  The results for the Connecticut races were similar to the presidential results, but McCarthy got only 11%, while his Democratic opponent got 82%.

In 1964, 93% of Princeton faculty favored Johnson and only 4% favored Goldwater.  Four of the ten Goldwater supporters in the poll were from Engineering.  The survey also asked about party identification:  55% said they were Democrats, 30% independents, and 15% Republican.  

In 1968, a poll of Princeton faculty found 71% for Hubert Humphrey, 6% for Richard Nixon, 8% for Dick Gregory (Freedom & Peace Party, 0.1% nationwide), and 7% probably wouldn't vote.  The poll also gave space for comments, and "many expressed disenchantment, even disgust, with the choices offered for president."  One physics instructor wrote "I do not support Humphrey-Muskie; I oppose the others.  Wallace, Agnew, and LeMay appeal to the kinds of hatred that put Hitler in power, and Nixon welcomes the fruits of those kinds of hatred."   Engineering gave Nixon his strongest support, although even there he was well behind.  There was no clear difference between the science, humanities, and social science departments--Nixon was below 5% in all.  

Despite the scattered nature of the information, some points are clear.  First, there were differences by field, and they weren't just Humanities and Social Sciences vs. STEM.  This suggests that there is some intrinsic connection between intellectual interests, or certain kinds of intellectual interests, and political views.    Second, there was a big gap between faculty at elite universities and the general public by the late 1960s.  This means that the recent decline in public confidence in higher education isn't a straightforward matter of conservatives reacting to their underrepresentation on university faculties:  if it were, it would have happened long ago. Of course, the general distribution of votes is a not a complete measure of political climate, and you could argue that the decline is a reaction to some other political change on campus, like the rise of DEI.  But if people didn't react to a clear and simple change--the collapse of Republican support among university faculty--it seems unlikely that they would react to a more subtle one.    I think the decline in confidence has been driven by Republican elites:  they became more critical of higher education in recent years, and that has influenced public opinion.    Third, there were large shifts from one election to the next until the 1960s.  From personal observation I'm confident that faculty support for Republican candidates in presidential elections has been consistently low since the 1980s.  But  in 1980 John Anderson, a Republican running as an independent, got a lot of support among students at elite universities.   Anderson represented a strand of Republicanism that was once important but has now disappeared, so that raises a question of how much of the decline of Republican support among university faculty was the result of changes in the Republican party.  That is, when they had an opportunity to pick a liberal/moderate Republican, did they take it?  Unfortunately, I didn't find any faculty polls for the 1980 election.

[Data from the archives of the Daily Princetonian and Yale Daily News]

Saturday, June 14, 2025

Interruption

My last two posts were on polls of college student voting from the 1940s-70s.  I intended my next post to be on polls of faculty voting, but I found more information than I expected, so it will take some time to put it together, so this post will fill the gap.

Earlier this year, David Shor posted the following figure on Twitter and wrote "Explicit antisemitic attitudes are now much more common among young voters" 


This was surprising to me, so I looked for similar questions to see if they showed the same pattern.  In 2022, a Pew survey asked if your opinion of Jews was very favorable, somewhat favorable, neither favorable nor unfavorable, somewhat unfavorable, or very unfavorable.  It asked parallel questions about six other groups:  Evangelical Christians, Catholics, Mormons, Muslims, mainline Protestants, and atheists.  The data set didn't include exact age, but classified people into four groups:  18-29; 30-49;50-64; and 65 and up.  

The means by age group, with 5=very favorable, 4=somewhat favorable.....1=very unfavorable.


Although Jews got lower ratings from younger people, they were still the highest-rated group, as they were among all age groups.  Moreover, Catholics, Evangelical Christians, "mainline Protestants (such as United Methodists, Episcopalians, etc.," and Mormons also got lower ratings among younger people, and the slopes were as large or larger than the slopes for the rating of Jews.  

In the oldest group, 51.2% said they had a favorable view of Jews and 5.2 said unfavorable; in the youngest, it was 39.7% and 7.5%.  The Blue Rose question didn't include a "neither favorable nor unfavorable option," and if you allocate that in proportion that gives about 8% unfavorable in the oldest and 16% unfavorable in the youngest.  That's a smaller difference than the Blue Rose data, but still substantial.  However, the comparison with the other religions suggests that the favorable/unfavorable question is not a particularly useful measure of antisemitism.  Other surveys have tried to measure antisemitism by asking people if they agree with various stereotypes about Jews, and this seems like a more promising approach in principle, but those questions are less common.

How should the differences among age groups in favorability ratings be interpreted?  I would say it's a mix of two things:  younger age groups have less favorable views of religion in general, and more favorable about the two groups that groups that are outside the bounds of traditional American religious beliefs.**  If you just extrapolate, it seems that atheists and Muslims will soon be the highest-rated groups among younger people.  However, I don't think that will happen--instead, the ratings of atheists and Muslims will level off, and there will be a tendency for ratings of different groups to cluster around 3.0:  i.e., more people treating religion or lack of religion as a private choice, not for them to judge either way.

*I learned about it from a recent Substack post by Matthew Yglesias.
**"Traditional" in terms of the memory of people who are alive today.

[Data from the Roper Center for Public Opinion Research]

Monday, June 9, 2025

College electors, part 2

 My last post said that there were large moves towards the Democrats at several elite universities between 1960 and 1964.  According to the polls, in 1960 the Republican vote share was higher at Yale, Princeton, and Stanford than it was in the general public; in 1964, it was lower.  What about other universities?  The Daily Illini led an effort to poll students at Big Ten universities in 1960 and 1964.  The results  (I just show Republican share, since they reported the two-party vote--they don't mention any significant write-ins).  

                       1960      1964
Illinois            52%        36%
Indiana           63%           
Iowa               58%          42%
Michigan        54%         
Michigan St.                   30%
Minnesota                       45%
Northwestern  65%         48%
Ohio St.           64%         39%
Wisconsin        56%

I found results for the University of North Carolina to represent the South.  In 1960, a poll found 52% for Kennedy and 42% for Nixon, with the rest undecided.  In 1964, it was 57% Johnson, 37% Goldwater, 5% write-ins, and 1% undecided.   Those were close to the overall results for the state in those elections (52% for Kennedy in 1960 and 56% for Johnson in 1964).  The swings at Ohio State, Iowa, and Illinois were similar to the swings in their states and considerably smaller than the swings at the elite colleges.  

 One of the stories on the 1964 Stanford poll breaks it down by class:  support for Goldwater was 37% among freshmen, 31% among sophomores, and 22% among juniors and seniors.  It also had information on parents' political preferences:  51% said both parents were Republican, 20% that both were Democrats, the the rest that the parents were independents or had different political preferences.  Taken together, these points suggest that political preferences changed while at college.  

I also ran across a few surveys of faculty, which I'll talk about in my next post.  


Friday, June 6, 2025

College electors

In a review of a biography of William F. Buckley, Louis Menand wrote: "In 1948, eighty-eight per cent [of Yale students] supported Thomas E. Dewey for President; four per cent backed Harry Truman."  Although the New Yorker has a reputation for thorough fact-checking, that seemed unlikely to me--you rarely find a margin that large in any group.   I looked in the archives of the Yale Daily News and found they reported a survey of Yale students which found 68% for Dewey, 21% for Truman, 7.5% for Norman Thomas (Socialist), 2.5% for Henry Wallace, and 1% for Strom Thurmond.*  The story said that graduate students were evenly divided--34% for Dewey and 34% for Truman--but there's no mix of 34-34 and 88-4 that produces 68-21 for the total.  By itself, this is just a piece of trivia, but the changing relationship between college education and vote is an important issue, so I while I was at it I looked for data on subsequent elections.  Procedures were not uniform, so there's some extra margin of error, but here they are:   

                R         D
1948      68%      21%   7.4% Thomas  2.5% Wallace 1% Thurmond
1952      67%      33%
1956      71%      29%
1960      64%      33%
1964      30%      70%
1968      27%      45%    11% neither   9% undecided
1972      12%      76%

I've written about similar surveys at Harvard before.  Harvard students were more favorable to the Democrats, but showed the same general pattern:  mostly Republican in the 1930s and 1940s and heavily Democratic since the 1960s.  

At Princeton:  

                 R          D
1948       72%        8%       8% Thomas   1.5% Wallace  10%  Thurmond
1952       73%      27%     
1956       73%      27%
1960       71%      29%
1964       27%      66%
1968       28%      40%      11%  Gregory   4% Wallace    4% Paulsen
1972      (35%      65%)

Princeton traditionally had a lot of students from the South, which explains Thurmond's strength in 1948.  In 1968, comedian Dick Gregory was on the ballot as candidate of the Peace and Freedom party, getting 0.1% of the national vote.  Pat Paulsen was another comedian who was not on the ballot but was running a joke campaign.  In 1972, there was a story about a poll, but it didn't give the totals, so I combined the numbers they gave to get an estimate.  Democratic support was consistently lower at Princeton than at Harvard or Yale, but it had a similar swing in the 1960s.  

Moving outside the Ivy League, here are figures for Stanford:

                R          D
1948       68%      10%       4% Thomas   8% Wallace  
1952       68%      28%     
1956       No data
1960       57%      36%      5% Pauling
1964       30%      70%
1968       24%      33%      18%  McCarthy 2.5% Wallace
1972       23%      67%

"Pauling" is the chemist Linus Pauling, who was not a candidate but was included on the student ballot.   He was an opponent of nuclear testing and supporter of nuclear disarmament, so he could be regarded as a leftist option.  Stanford shows the same pattern as the others.  

The long-term movement from Republicans to Democrats is no surprise, but the timing is interesting.  Rather than a gradual shift, there was a sudden swing between 1960 and 1964.  In 1968, there were a lot of protest or "none of the above" votes, but the 1972 distribution was similar to what it had been in 1964.  That is, in less than a decade, the campuses went from solidly Republican to solidly Democratic.  Presumably the change in 1964 was a reaction against Goldwater and/or his supporters, not a positive attraction to Johnson.  That raises a couple of questions.  First, how much difference did the candidates make?  If the Republicans had nominated different candidates (say William Scranton in 1964 and George Romney in 1968), would the eventual change have been smaller or would it just have been more spread out?  Second, why didn't Republicans make more effort to win back the universities, especially the "elite" ones?  Political analysis wasn't as data-driven back in the 1970s, but this change was big enough to be visible without high-quality data or elaborate analysis.  College graduates were a minority, but still a substantial group, and one that was clearly going to grow.  Moreover, college graduates, and particularly graduates of elite colleges, have extra political weight--they are more likely to vote, donate money, appear in the media, and run for office.  But I don't have the impression that Republicans ever made much effort to reverse or even contain the shift.  


*I've said this before, but I'll say it again:  It's remarkable that online editions of newspapers and magazines haven't developed reasonable conventions about including links to sources.  The New Yorker didn't have any link for the 88-4 numbers, but it did have a link for "Harry Truman"--another New Yorker story about his general impact.