Thursday, December 29, 2022

Out of the file drawer, part 2

 My last post was about data on perceptions of moral conditions from 1949 to 2022.  There is a clear decline over the period, but I wanted to go beyond that and consider questions like whether the decline was steady or concentrated in particular periods and whether it's something that continues today.  A simple starting point is a regression model with time and time squared (plus dummy variables for the different question) as predictors.  In this model, the squared term is statistically significant (t=2.3)--I tried a couple of higher order terms and they were not.  Another model has two linear terms for different periods--the best fit comes with the periods 1949-68 and 1969-2022.  Predicted values for the two model are shown in the figure:


Both models (which fit about equally well) indicate that the decline was larger in the early years, but the predictions diverge in recent years--according to the quadratic model, the low point came around 2007, and assessments have becoming more favorable since then; according to the spline model, the decline is continuing.  With both models, there is some correlation in the residuals--periods when the values are consistently above or below the predicted values.  So overall, I don't think it's possible to be sure about whether the decline has stopped, but it's clearly slowed down.

This connects to a point that I've made before--that views about people and society in general became more negative in the 1960s and 1970s, but haven't changed much in the last few decades.  So accounts which attribute the recent rise in political polarization to discontent about people or society or economic conditions don't fit the timing.  In principle, you could argue that there was some kind of delayed response--that discontent didn't start affecting political views until time had passed.  However, another possibility, which I find more convincing, is that polarization in the public is a reaction to political developments--that is, it started with elites.

[Data from the Roper Center for Public Opinion Research]    


Wednesday, December 21, 2022

Out of the file drawer, part 1

 Sometime around 2000, I searched for questions about the general moral condition of the country.  I wanted to trace changes in the assessment, so I was only interested in questions that had been asked at least twice.  I found seven questions with a total of thirty occasions, ranging from 1949 to 1999.  I didn't try to publish the research, although I talked about it at a conference or two, but I thought about it from time to time and finally came back to it, thinking that at least I'd have more data to work with.  To my disappointment, I found only a five more occasions, and none after 2005.  The questions and results are listed below--I give the results in the form of favorable vs. unfavorable assessments.  

1.  On the whole, would you say that you are satisfied or dissatisfied with the honesty and standards of behavior of people in the country today?

Positive    Negative          Year       

34%         59%               1963

27%         66%               1965

26%         66%               1966

22%         72%               1973

33%         63%               1986

23%         71%               1987

24%         73%               1991

20%         78%               1992

27%         68%               1992

32%         68%               1998

21%         74%               1999

2.  Do you think people in general today lead as good lives--honest and moral--as they used to?

47%         46%               1952                         

39%         52%               1965                         

30%         66%               1976

26%         71%               1998

21%         73%               2002

21%         74%               2005

3.  Do you think that young people today have as strong a sense of right and wrong as they did, say, fifty years ago?

57%         34%               1952                   

41%         46%               1965                         

20%         78%               1998                         

15%         82%               1999                         

19%         76%               2002

18%         79%               2005

4.  Which of the following statements comes closest to expressing how you feel about the state of morals in this country at the present time?  (Pretty bad vs. pretty good).

37%         55%               1964                    

19%         77%               1996                    

32%         63%               2004

5.  Do you believe that life today is getting better or worse in terms of morals?

20%         52%               1949             

 8%         78%               1968                               

17%         70%               1985

17%         69%               1986

6. Do you believe that life today is getting better or worse in terms of honesty?

24%         36%               1960

13%         61%               1968

7.  Do you personally agree or disagree with those who feel that there is something morally wrong with the country at this time?

35%         61%               1976

25%         71%               1992

19%         77%               1993                    

Then I discovered the good news--almost every year since 2002, Gallup has asked "Right now, do you think the state of moral values in the country as a whole is getting better or getting worse?"  Results can be found at: https://news.gallup.com/poll/393659/record-high-americans-rate-moral-values-poor.aspx

So now I can put it all together and get a picture of changes since 1949:


There's a pretty clear downward trend, but to go beyond that observation, you have to consider the fact that the questions aren't identical, and even if you trust my judgment that they are similar, they might get somewhat different responses.  The simplest way to adjust for this is to calculate the mean for the question and subtract it from the score at each time.  The results:


This way, it doesn't seem like steady decline.  I'd describe it as a decline in  the 1960s, followed by some recovery and then stability into the 1980s, then a decline into the 1990s, and then rough stability, or maybe even some increase.  I've experimented with fitting some models, but haven't found anything that I have much confidence in yet, so I'll save that for a future post.

[Data from the Roper Center for Public Opinion Research]


Friday, December 9, 2022

Substitute

 A couple of months ago, I had a post which discussed research and reporting on the link between mental illness and mass shootings.  Andrew Gelman blogged about it the other day, and it has become my most viewed post (by a large margin) so I thought I should follow up on it.   However, after I started a post on it I couldn't think of anything interesting to say.  I'll come back to the issue, but meanwhile here's a post on a totally unrelated subject: 

Georgia just finished its runoff election for Senator.  It's one of only two states that have runoffs in general elections (the other is Louisiana)--everywhere else, the winner is the candidate who gets the most votes on election day.  The Washington Post had a story on the origins of the system--it involved a state legislator named Denmark Groover who lost his seat in a three-way race in 1958, made it back to the legislature, and dedicated himself to getting a runoff added.  He also was a hard-line segregationist who helped to devise measures to limit black voting power after court rulings and legislation made it more difficult to simply prevent black people from voting.  So the runoff was seen as a measure to protect white supremacy, and later in life Groover said that was how it was intended.  

The history was interesting, but what surprised me was that the controversy continues.  The story concludes by saying "voting rights groups in Georgia overwhelmingly support abolishing runoffs" and quoting the director of a voting rights group as saying "it is a relic of Jim Crow, it is suppressive, inefficient and is also fiscally irresponsible.  It needs to just go away."  The reporter also seems to have been persuaded--he quotes several other critics and no defenders.

Regardless of the origins of the runoff in Georgia, the idea that it should take a majority vote to win seems to fit with the popular idea of democracy, so there's a good case for the runoff in principle (Brazil and France both have runoffs in their presidential elections).  So I was interested in looking at public opinion on the issue.  I found only one question, from 1984:  "In some states, if no candidate wins more than half of the votes in a primary election, a runoff primary is held between the top two candidates. Do you think this is a good system, a bad system, or don't you have an opinion on this?"  Although that asks specifically about primary elections, it involves the same general issue, and applies more widely:  quite a few Southern states had (and I think still have) runoff elections in primaries. 

40% said that it was a good system, only 11% said it was bad, and 45% said they didn't have an opinion (the rest said they didn't know--I eliminated them from the rest of the analysis, although you could make a case for combining them with "don't have an opinion").  

The breakdown by race:

                      Good      Bad          No opinion
Black              43%        11%           46%
Non-black      43%         13%          44%

No discernible difference.

Region:

East                 40%           15%           45%
Midwest          38%           10%           52%
South               48%           14%           38%
West                 46%             8%           46%

Maybe some differences, but it's hard to be sure, except that Southerners were less likely to have no opinion.

Education reduced the share of "no opinion" but didn't have much impact on the ratio of favorable to unfavorable opinions.  There were no visible differences by party or ideology.  Women were a bit more likely to have no opinion, and to favor a runoff if they had an opinion.  The strongest demographic factor was age--young people were more likely to favor a runoff.  

18-29               49%               8%            42%
30-44               47%             13%            41%
45-64               43%             13%            44%
65+                  25%             16%            58%

I also considered region by race:  Southern whites were more favorable and less likely to have no opinion, but there were no clear regional differences among blacks (the survey oversampled blacks, so the numbers were reasonably large).

While doing this post, I discovered that Jesse Jackson had called for an end to the runoff system, and was even suggesting that he might make it a condition of supporting the Democratic nominee (the survey was taken in June, so the issue was in the news at the time).  That makes the absence of a racial difference particularly interesting.  My guess is that intuitions about fairness dominated everything else, among voters who had an opinion.  Whether a runoff actually worked* against the interests of black voters is a complex issue, so even voters in states with runoffs wouldn't easily be able to judge from experience.  And unlike the Electoral College, the runoff didn't have a long history, so attachment to tradition wasn't a factor.

*I say "worked" because the effects may have changed since 1984, given changes in the racial composition of the parties and increased willingness of white voters to support black candidates.  


[Data from the Roper Center for Public Opinion Research]

Tuesday, November 29, 2022

Representation

 A few weeks ago, I had a post on opinions about whether the Supreme Court should consider public opinion when making decisions.  There was a strong relationship to education:  more educated people are more likely to say that it should just consider the legal issues, while less educated people are more likely to say that it should consider what the public thinks.  There's a similar question that applies to elected officials--should they do what their constituents want, or should they use their judgment about what is in the best interests of their constituents?  

Although this is a classic issue in political theory, I could find only one relevant survey question, from 1993:  "When your representative in Congress votes on an issue, which should be more important:  the way that voters in your district feel about the issue, or the Representative's own principles and judgment about what is best for the country?"  70% said the way that voters feel, and 23% said the representative's principles and judgement (3% volunteered that it should be both and 4% said they didn't know).  In contrast to opinions about how the Court should decide, opinions on this issue had little or no connection to education (if there's a relationship, it's curvilinear, with people at middle levels of education most likely to favor going with the voters). Opinions had some connection to political views, with liberals and people who had voted for Clinton more likely to favor representatives using their own judgment--but even they had solid majorities in favor of following the voters.  

While searching for questions, I found one from 1992 on a related issue:  how representatives should vote on choosing a president if there was no Electoral College majority (in the summer of 1992, Ross Perot was running about even with Bush and Clinton, so this seemed like a real possibility).  The options were voting for the candidate who got the most votes across the nation, the state, or the congressional district, or voting for the one who they thought would make the best president.  Opinions on this question were related to education:  people with more education are more likely to say they should go with the district and less likely to say they should vote for the candidate who they think would make the best president (the other two options are about equally popular among all educational levels).  It's a strong relationship:  support for following the district goes from about 8% among people with no college to 30% among college graduates; support for choosing the candidate who they think would make the best president goes from about 45% among people with no college to 20% among college graduates.

So when thinking about the Supreme Court, more educated people are less likely to favor the "populist" position; when thinking about elected representatives, that's not the case.  Why?  The Supreme Court justices have an area of specialized expertise--interpreting the law.  Elected representatives don't have any definite area of expertise--if they have any advantage over the public, it's general judgment and experience.  It seems plausible that education increases respect for expertise, but not for claims of superior judgment and experience (if anything, it may increase confidence in your own judgment, so you're less likely to defer to others).   The difference in the relation of education to opinions about votes on the issues and votes on the president is puzzling, but it could be that educated people have a better understanding of how the process would probably work--in practice, voting for the candidate they think best would mean voting for the candidate of your party.  Given a choice between voting by party and voting by the wishes of their district, the second seems more fair.  But overall, I think these results support my suggestion that distrust in politics is distinct from distrust in experts.

[Data from the Roper Center for Public Opinion Research]

Sunday, November 20, 2022

Who has changed?

 People with more education used to be more likely to vote Republican than people with less education.  Things have now reversed, so more educated people are less likely to vote Republican.  Is that because more educated people have moved towards the Democrats, or less educated people have moved towards the Republicans, or some of both?  The figure shows average party identification in the General Social Survey, 1972-2018 (I limit it to whites, because the black vote is overwhelmingly Democratic and there's never been a clear educational divide).  

Republicans are 3, Independents 2, and Democrats are 1, so an average of 2.0 means equal numbers of Democrats and Republicans.  Between 1972 and 1990, both college graduates and people without college degrees moved towards the Republicans, at about the same rate.  Since the 1990s, the groups have diverged:  college graduates have moved towards the Democrats, while people without college degrees have stayed about the same.

So the reversal of the "education gap" has been mostly the result of changes among more educated people.  Of course, there may also be currents of opinion that affect people of all educational levels, so it's possible that the changes among college graduates reflect the general current of opinion, while the changes among less educated people reflect the general current plus some offsetting factor.  

However, the practical implications of the two interpretations aren't too different.  Either Republicans should be concerned about the trend among educated people, or they should be concerned about the general current.  Either way, it means they should be concerned about stopping their losses among educated people, whether that's by specifically appealing to educated people or by appealing to people in general.  But that doesn't seem to be the case--as I've mentioned before, they seem to be fascinated by the idea that they can win by becoming a "working-class party" (see this piece by Josh Hawley for an example), and uninterested in winning back educated voters.    


Sunday, November 13, 2022

Law and public opinion, part 2

 It took a while, but I am returning to a question I wrote about in a previous post:  ""When the Supreme Court decides an important constitutional case, should it only consider the legal issues, or should it also consider what the majority of the public thinks about that subject?"  It was asked in 1987, 2005, 2013 (twice), and 2015.  In my previous post, I noted that there was a strong relationship to education:  more educated people were more likely to say it should only consider the legal issues.  I also noted that support for the "legal issues" option seemed to be increasing.  Now I want to connect those, by considering the relationship between education and opinions at three different times, 1987, 2005, and 2015.  On the average, educational levels have been rising as older generations are replaced by more educated younger ones, so it's reasonable to ask if the increase in support for "only consider the legal" issues just reflects rising levels of education--in fact, it's possible that support has been declining within educational categories.  There's also a question of whether the educational differences have remained constant.  The following table gives opinions in the form x-y, where x is the percent saying "only legal issues" and y is the percent saying consider what the majority thinks--they add to less than 100 because some people said that it should be some of both:

                                             1987                2005              2015

No HS diploma                   15-81                23-72             29-69
HS only                               26-70                40-57             43-54
Some college                       39-59                57-39             60-37
College grad                        62-35                66-29             74-24

There was a strong relationship to education at all three times, but support for the "only legal issues" option rose in all educational groups.  As I mentioned before, the 1987 figures may have been affected by the context--the survey was taken during the nomination of Robert Bork, who seemed to delight in taking unpopular positions--but there was also an increase from 2005 to 2015 in all educational groups.  Also, there was little or no relationship between opinions and partisanship in 1987--to the extent that support for "only legal issues" was a reaction against Bork, you'd expect it to be more popular among Democrats.   (There was also no clear relationship to partisanship in 2005;  Republicans were a little more likely to favor considering the majority in 2015).  

Many accounts of recent politics hold that there's been a shift towards "populism" in a broad sense--a belief that the public should decide directly rather than leaving it to experts and authorities.  There's certainly some evidence supporting that, particularly the decline in confidence for most institutions.  

 There have been a few questions about the power of the Supreme Court over the years.  In 1957, Gallup asked "Some people say that the Supreme Court has too much power these days.  Do you agree or disagree with this?"  Then in 1982 a CBS News/NY Times survey asked " Some people think the Supreme Court has taken too much power that should belong to the President and Congress. Other people think the Supreme Court has been carrying out its proper responsibilities under our system of government. Do you think the Supreme Court has taken too much power, or is it carrying out its proper responsibilities, or don't you know enough about this to have an opinion?"  Finally, starting in 2015, the Pew Research Center has asked "Do you think the US Supreme Court has too much power, too little power, or the right amount of power?"  They're not identical, but seem similar enough that a comparison is reasonable.  The results:

                Too much        Not too much

1957                26%                    53%
1982                17%                    39%
2015                36%                    61%
2019                21%                    74%
2020                33%                    65%
2022 (Jan)        41%                    58%
2022 (Aug)       45%                    53%

Belief that it had too much power has increased in the last few years (interestingly, it was almost as high in January 2022 as in August), but didn't show much trend before then.  So, as I've suggested before, the decline in institutional confidence might involve a distrust of politics rather than a distrust in "experts". 

[Data from the Roper Center for Public Opinion Research]

Friday, November 11, 2022

How good was it?

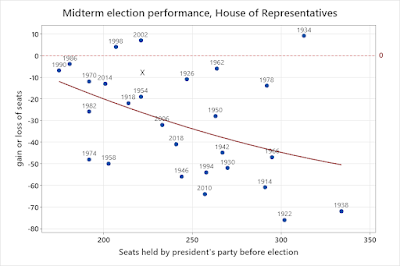
The President's party almost always loses seats in midterm elections.  But is it normal to lose a lot of seats, or do people just remember those cases better than those in which the president's party loses a few seats?  That is, did the Democrats have an outstanding performance this year, or just a pretty good one?  I looked at all midterm elections since the House of Representatives went to 435 members (1914 was the first).  The mean loss of seats was 31; the median was 28.  It looks like the Democrats will lose 5-10 this time, which would be the 6th or 7th best out of 28.  But we should also consider the starting point--when you come in with a lot of seats, it's hard to gain and easy to lose.  The figure plots the change against the number of seats the party had in the previous House:


"X" is the approximate location of the 2022 election.  Whether or not you consider the number of seats coming in doesn't make much difference for 2022--either way, it's a good but not exceptional performance.  But it makes a significant difference in some cases:  the big losses for the Democrats in 1966 were a normal performance and the small losses in 1978 were an unusually good one.  I'm not old enough to remember the 1966 election, but I do remember 1978 (it was the first election in which I was eligible to vote) and I had thought of it as a very bad year for the Democrats.  I think that's partly because the late 1970s were a conservative period in some respects (e. g., Proposition 13 passed in 1978), and partly because the Carter administration ended in failure, so there's a tendency to remember it as an unbroken series of failures.  Similarly, I had remembered 2006 as a bad year for the Republicans, but their losses were only a little worse than you could expect.  Like Carter, Bush ended badly, and that colors the memory of everything that happened in his presidency.  And 1934 is a much more impressive accomplishment than 2002 or 1998, although all three involved similar gains for the incumbent party.  

Tuesday, November 8, 2022

Predictions

Although I study public opinion, that doesn't give me any special insight as far as election predictions are concerned.  With public opinion on any topic, there are lots of questions you can and should consider, and differences of a few percent either way don't matter much.  But with elections, there's only one question that matters--the choice of candidates--and differences of a few percent are important.  Moreover, the results don't depend on public opinion, but on the opinions of the voters.  So predicting elections involves questions about predicting who will vote and identifying and adjusting for relatively small "house effects"--tendencies for particular polls to over- or under-estimate support for different parties--and then you have questions about translating votes into seats.  Still, it's fun to try, so here are my predictions:
Senate 51R-49D
House  235R-200D

In this election, people are also concerned about how the outcome will affect the future of democracy.  The study of public opinion should provide some insight into that.  There are several reasons for optimism:
1.  An independent judiciary with a long accumulation of precedent.   Trump and his allies lost almost all of the lawsuits that they filed over the 2020 election.
2.    Bureaucracy.  There are a lot of agencies that have routines which are based on a combination of laws, regulations, and tradition.  Even if political officials want them to change direction, they will continue to try to follow those routines.  The routines generally involve following relatively impersonal rules, so bureaucracies usually resist demands to "reward friends and punish enemies" or manipulate statistics to make the party in power look better.  This is connected to point 1--in many cases, routines are based on an interpretation of legal requirements.
3.  Political culture.  Americans don't generally take to the streets to protest.  After the 2006 election in Mexico, their were several months of protests by supporters of the defeated candidate, Andrés Manuel López Obrador.  According to Wikipedia,  "López Obrador and his supporters began organizing mass protests, marches, and civil disobedience, culminating in a massive rally in Mexico City's historic Zócalo on 30 July 2006. Estimates of the crowd at the rally range from 500,000 to 3,000,000 supporters.[34] Additionally, López Obrador's campaign set up plantones, or encampments, inside the Zócalo and along Paseo de la Reforma, one of Mexico City's main arteries, for 47 days and slowing traffic for hours."  Estimates of the number at Trump's January 6 rally range widely, but the upper end seems to be 80,000, and that was a one-time event--there were no mass protests before or after.  This is also connected to point 1:  even people who wanted to overturn the results of the election focused on legal or quasi-legal efforts like "forensic audits."  At some level, Americans have a lot of respect for the political and legal system:  the remedy for injustice is appeal to some higher authority (real or imagined) rather than violent resistance.

On the other side, there is a reason for pessimism:  the complexity of the American electoral system provides a lot of opportunities to spread doubt about unfavorable results and manipulate the rules to the advantage of your side.  So people can undermine democracy without taking a definite stand against it--in fact, they can undermine democracy while imagining that they are upholding some higher value (like the rule of law or the Constitution).  Also, long tradition, combined with the difficulty of constitutional amendments, makes it hard to make changes in election procedures--e. g., attempts to have more uniform standards for elections are denounced as "a federal takeover," and reforms like multi-member districts are not even considered.

The result is that there is little danger of a coup, or the suspension of elections, or jailing of opposition candidates.  But there is serious danger that government will continue to be ineffective and unresponsive, or even get worse.  

Wednesday, November 2, 2022

Conjectures and refutations

Earlier this year, I had a post about a survey of college students on free speech issues.  Students at more selective universities (measured by the admissions rate) were more willing to accept controversial speakers.  I suggested two possible explanations:  "it could be because they are more liberal, and liberals tend to be more favorable to the principle of free speech, or because they are more intellectually sophisticated, and more intellectually sophisticated people are more favorable to the principle (or some mix of both)." I couldn't test those ideas, because I didn't have information about ideology.  However, there's an updated version of the survey, and I obtained a copy of the data from the sponsor (the Foundation for Individual Rights and Expression).  That contains a question about ideology (very conservative to very liberal, plus options for "haven't thought about this" and other), making it possible to see how it is related to tolerance for speakers.  

The hypothetical speakers include four right wing examples--abortion should be completely illegal, Black Lives Matter is a hate group, the 2020 election was stolen, and transgender people have a mental disorder--and four left-wing examples:  the 2nd Amendment should be repealed so that guns can be confiscated, undocumented immigrants should be given the right to vote, white people are collectively responsible for structural racism and use it to protect their privilege, and religious liberty is used as an excuse to discriminate against gays and lesbians.  For each one, respondents were asked if the speaker definitely should be, probably should be, probably should not be, or definitely should not be allowed.  

Here is the relationship between admission rate and tolerance of the two types of speakers:


The figures for left-wing speakers are in red and those for right-wing speakers are in blude.  I indicate a few universities and colleges by name:  Chicago, which is among the most tolerant of both; Hillsdale, which is by far the most tolerant of right-wing speakers; Smith, which is the least tolerant of right wing speakers; and Wyoming, which is the least tolerant of left-wing speakers.  One point that stands out is that there is less tolerance of right-wing speakers--in fact, only one of about 200 colleges surveyed (Hillsdale) is more tolerant of right-wing than of left-wing speakers.  Of course, the examples can't be exactly parallel, so you could argue that in some sense the right-wing ones are more extreme.  But the same gap, with about the same magnitude, appeared in the previous survey.  

Moving on to the relationship with selectivity, more selective places are clearly more tolerant of left-wing speakers.  They are slightly less tolerant of right-wing speakers, although it seems like the relationship may be non-monotonic, with the lowest tolerance occurring at moderately selective schools (those that accept about 30% of applicants).  

If you add tolerance of left and right-wing speakers together, more selective schools are more tolerant:

It seems to be a non-linear relationship, with little difference from about 30-100% and rising as the admission rate goes toward zero.  If you regress overall tolerance on the admission rate, the t-ratio is about 6; if you regress it on the inverse of the admission rate, the t-ratio is about 7.6.   

What about ideology?  More selective schools are more liberal:


The average ideology (weighting the schools equally) is 3.0, which is more liberal than the general public aged 18-23 (3.7 in 2021, according to the GSS, which has an almost identical question on ideology).  Among the most selective (admission rate of less than 20%), 26% say they are very liberal, 39% somewhat or slightly liberal, 11% moderate, 12% slightly, somewhat, or very conservative, with 3% no opinion and 7% other.  But even at the least selective, they generally lean to the left:  at those with admission rates of 80-100%, 44% are some variety of liberal, 16% moderate, and 26% some variety of conservative.

What about the relationship between ideology and tolerance?  


I also include the people who didn't place themselves on the liberal-conservative scale.  People who said that they were neither liberal nor conservative were asked a follow-up question giving three options:  democratic socialist, libertarian, and other.  Within the liberal to conservative categories, there is a tendency for conservatives to be more tolerant.  But the people who said they "haven't thought about it" are the least tolerant.  As I said before, tolerance isn't a natural state--it's something that people need to be persuaded to accept.  

One of my hypotheses about the relationship between selectivity and tolerance--that it results from ideological differences--is refuted.  The survey doesn't contain any question that could reasonably be regarded as a measure of intellectual sophistication.  However, while there are certainly individual exceptions, it seems safe to say that on the average students at more selective universities are more intellectually sophisticated than those at less selective ones.  So the other hypothesis--that intellectually sophisticated people are more tolerant--is consistent with the data.  

I found a number of other interesting things in the data, so I will return to it in a later post, after I get to a few other things which I've been meaning to write about.  

[Thanks to the Foundation for Individual Rights and Expression for providing the data]


Thursday, October 27, 2022

No quarter, part 2

 In my last post, I discussed the idea that the combination of social liberalism and economic conservatism (or what is sometimes called "libertarianism") is an "empty quarter".   Of course, it's not literally true, but could the combination be underrepresented in some sense?  The figure below shows a hypothetical distribution of economic and social opinions.  I start by assuming a uniform distribution for both (which makes it easier to see the pattern in the picture), and then omitting everyone with an economic conservative/social liberal combination: 


The result is that the variance of opinions on social issues is larger among economic liberals than among economic conservatives, and the variance of opinions on economic issues is larger among social conservatives than among social liberals.  In my example from last time, I used abortion as the social issue.  The question had only two options, so the variance is just a function of the mean.  But the economic issue (redistribution) is on a scale of 1-7, so the variance is meaningful.  That is, the "empty quarter" hypothesis says that the variance in economic opinions will be larger for people who say that abortion should not be legal.  A comparison of standard deviations in three periods:

                           Legal      Not legal

1978-98             1.96           1.96
2000-2010         1.97           1.98
2012-2021         1.95           2.09

They are virtually the same in the first two periods, but there is some difference in recent years.  I tried a few more "social issues":  whether marijuana should be legal, whether sex between two adults of the same sex is morally wrong, whether there should be laws against the distribution of pornography to adults, and whether the Supreme Court had been wrong to rule against school prayer, using the same three periods for each.  In thirteen of the fifteen comparisons, the standard deviation of opinions on redistribution was larger among people who took the conservative position on the social issue.  The difference also seemed to become larger in the third period.  

I'm not sure that these results would hold up if you controlled for other potentially relevant factors (especially education).  I also haven't tried to translate the differences in standard deviation into an estimate of the degree to which the "libertarian" quarter is underrepresented, but I think that it's small.  Nevertheless, the results suggest there may be something to the "empty quarter" hypothesis, particularly in recent years.  Recent political history seems consistent with the idea that the economic conservative/social liberal combination is weakening.  Up until about ten years ago, quite a few people saw it as the wave of the future, but it seems to have faded in recent years, with some erstwhile libertarians shifting toward the "populist" right.  

If I had world enough and time, I would investigate this further, but I don't, so I'll just note it as a possibility.  


Friday, October 21, 2022

No quarter

 The other day, Paul Krugman proposed that Liz Truss failed because her program appealed to people who are to the right on economics and to the left on social issues:  "a barren quadrant where few voters may be found."  He refers to an analysis by Lee Drutman, which classified people into four groups:  45% to the left on both, 23% to the right on both, 29% to the left on economics and to the right on social issues, and only 4% to the right on economics and to the left on social issues.  Clearly the exact numbers will depend on the questions you use to measure the dimensions, and in an earlier post I objected to some of his choices, but didn't propose an alternative.  I'll start with a simple one in which the economic dimension is measured by a GSS question:

"Some people think that the government in Washington ought to reduce the income differences between the rich and the poor, perhaps by raising the taxes of wealthy families or by giving income assistance to the poor. Others think that the government should not concern itself with reducing this income difference between the rich and the poor. Here is a card with a scale from 1 to 7. Think of a score of 1 as meaning that the government ought to reduce the income differences between rich and poor, and a score of 7 meaning that the government should not concern itself with reducing income differences. What score between 1 and 7 comes closest to the way you feel?"

That's a pretty good summary of the basic difference between left and right on economic issues.   To make the tables simpler, I'll divide it into left (1-3), middle (4), and right (5-7).  There's no parallel question for social issues (and it's hard to imagine one), so I'll use a question on an important and long-standing issue: whether a woman should be able to get a legal abortion if "she wants it for any reason."  That's a yes/no question (I'll omit the small number of don't knows.  Over the whole period for which there is data (1978-2021), there is no association between opinions on these questions:  43% of economic liberals, 40% of economic moderates, and 42% of economic conservatives are in favor of legal abortion.    But in recent years, a positive association has appeared:


That means that there has been a change in the distribution among groups, even though overall opinions on both redistribution and abortion have been pretty stable

                  1978-2000     2002-2008      2010-2021

LL                 18%               21%               27%
LR                 29%               25%              23%
RL                 15%               14%               13%
RR                 19%               21%               21%

The  percentages don't add to 100--the rest are people who were exactly in the middle (4) on redistribution.  Although the LR and RL groups have declined, they still make up 36%, compared to 48% for "consistent" liberals and conservatives.

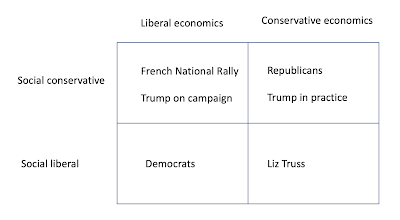
A few years ago, I had a post noting that there were a lot of people with RL or LR positions, but few politicians trying to represent them.   Krugman offers this diagram:


In his analysis, the conservative economics/social liberal combination is rare, so there are only three substantial groups among the public, and they all have representation.  However, as I've noted several times, there's no evidence that ordinary voters saw Trump as liberal on economic issues.  The characterization of the National Rally is also questionable.  So the puzzle is still there.

PS:  Although I wasn't following closely, I don't think that Truss's problem was that her policies were inherently unpopular--what hurt her was the reaction of the financial markets.  Also, it's a parliamentary system, so a party can easily drop a leader when they become a liability, and it sounds like she started with relatively weak support among Conservative MPs.   


Monday, October 17, 2022

Law and public opinion, part 1

Starting in 1987, a number of surveys have asked "When the Supreme Court decides an important constitutional case, should it only consider the legal issues, or should it also consider what the majority of the public thinks about that subject?"  I was interested in seeing if there were any consistent partisan or ideological differences on this question, but got diverted when I did a cross-tabulation with education:


                                           Legal        Depends (vol.)      Public Opinion
No HS diploma                    32%               4%                     64%
HS                                        42%               4%                     54%
Some College                       57%                4%                    40%
BA                                        64%               5%                     31%
Grad educ                             76%               5%                     19%

This is a strong relationship, by the standards of public opinion data--about as strong as the relationship with a question about how much attention you had been paying to the confirmation hearings for John Roberts, which were going on at the time.   A little more investigation showed that age was also a strong predictor, although not as strong as education--older people were more likely to say that the court should only consider the legal issues.  So far, I have only analyzed one survey, so this could be either a cohort or an age effect. Gender and race also seemed to make some difference (women and blacks are more likely to say that it should consider public opinion), but there's no evidence that religion mattered.  

Over time, there seems to have been some movement towards saying that the court should just consider the legal issues:

                      Legal        Public Opinion
9/1987            32%             60%
7/2005            48%             46%
3/2013            46%             45%
5/2013            47%             45%
6/2015            52%             40%

However, the 1987 survey was taken during the Robert Bork confirmation hearings, so the results for that survey may represent a reaction against him--unlike subsequent nominees, he made it clear that his legal interpretations would lead him in unpopular directions.  


 [Data from the Roper Center for Public Opinion Research]

Monday, October 10, 2022

Self-deception

 A few weeks ago, Ross Douthat asked "How does a party that historically represented the rich and big business adapt to a world where conservatism’s constituencies are not just middle class but blue-collar, downscale and disappointed with the modern American economy?"  My answer is in the title to this post.  In late 2020 I wrote about a question that had been asked a number of times between 1987 and 1996 and then again in October 2017:   "in general, do you think that the [Democratic/Republican] Party favors the rich, favors the middle class, favors the poor, or does it treat them all the same."  I compared a couple of surveys from the first period to the 2017 survey, and noted that the perceptions of (self-described) Republicans had changed:  in the 1980s and 1990s, about 30% said that the Republican party favored the rich; in 2017, that had fallen to 12%.  At the same time, the percent of Republicans who said that the Democrats favored the rich went from 18% in 1987 to 24% in 1996 to 34% in 2017.  This post will look at the same data from another angle.

The 1996 survey had a question about vote in a hypothetical race involving Dole vs. Clinton (omitting Perot) and the 2017 survey had a question about vote in the 2016 election.  I regressed this on dummy variables representing perceptions of the parties:  Republicans favor the rich, the middle class, and the poor, and Democrats favor the rich, the middle class, and the poor ("treat them all the same" is reference category for both).  The estimates, predicting the chance of Republican support:

                            1996               2017

R Rich                  -2.2               -3.7

R Middle              -0.3               -0.0

D Rich                    1.8                2.0

D Middle                0.2                0.0

D Poor                    2.0                1.9

Same                       0.7                0.6

The standard errors are all around 0.3 in 1996, and about 0.3 to 0.5 in 2017.  I omit the estimates for people who thought the Republicans favored the poor--very few people believed that, so the standard errors were very large.  "Same" is people who gave the same rating to both parties (e. g., said that both favored the rich).  They were somewhat more likely to favor the Republican candidate, which could be the result of a Republican advantage on perceptions of competence or non-economic issues.  

At both times, being seen as favoring the rich (as opposed to the middle class or poor) hurt both parties, and being seen as favoring the poor hurt the Democrats.  All of the estimates were about the same at both times except for Republicans favoring the rich, which was almost twice as big in 2017:  that is, a perception that the Republicans favored the rich was more damaging in 2017.  

Of course, the relationship could go in either direction:  people could form perceptions of the parties and use them in deciding how to vote, or people could decide who to vote for and adjust perceptions to support their decision.  It seems safe to say that both are involved, but my guess is that the second one is more important.  That is, there's been a change in the way that Republican voters rationalize their decision:  they are increasingly unwilling to see their party as favoring the rich.  Several years ago, I proposed that there had been a growth of social egalitarianism, and that at one time "Republicans thought of themselves as the party of successful people.  Now both parties think of themselves as the party of the common people, plus the fraction of the elites who care about or understand the common people."  I think these results support that analysis.

Returning to Douthat's question, why haven't Republicans responded to the changes in party support by shifting their policies?  One reason is ideology--both in the positive sense of an attachment to tax and spending cuts and the negative sense of a dislike for anything associated with "the left."    Another is that "downscale" (less educated) voters are shifting towards the Republicans anyway.  This has been going on for a long period of time, and doesn't seem to be closely connected to changes in party policy.  So rather than making changes in policy, party leaders can congratulate themselves on being "the party of the working class" (and on being unpopular among "elites") while following the same policies as before.  

PS: here is the trend on beliefs about favoring the rich in the whole sample (Democrats, independents, and Republicans):


There's no clear change for Republicans, and some evidence of an increase for the Democrats (the Pearson correlation with time is .73, and the Spearman correlation is .65).  

[Data from the Roper Center for Public Opinion Research]

Tuesday, October 4, 2022

Lost in translation

 A few days ago, the New York Times had an opinion piece by Huw Green, a clinical psychologist, which said "A clear causal link between psychiatric illness and gun violence has not been established..."   I followed the link, which was an interview with Ragy Girgis, a professsor of psychiatry at Columbia University.  That story had a caption saying "Findings from the Columbia database help dispel the myth that having a severe psychiatric illness is predictive of who will perpetrate mass murder."  It also contained a link to an article by Dr Girgis and others using the database (an attempt to compile a comprehensive list of mass murders since 1900), which said "the prevalence of psychotic symptoms among mass murderers is much higher than that in the general population (11% v. approximately 0.3-1%)."   That is, people with psychotic symptoms were between 10 and 30 times more likely to commit mass murder than people without psychotic symptoms.  

How did we go from 10 to 30 times more likely to "dispel the myth"?  The interviewer asked "Are people with mental health disorders more likely to commit mass shootings or mass murder?"  The answer started "The public tends to link serious mental illnesses, like schizophrenia or psychotic disorders, with violence and mass shootings. But serious mental illness—specifically psychosis—is not a key factor in most mass shootings or other types of mass murder.."  That is, it didn't answer the question that had been asked, but a different question:  whether most mass murders are committed by people with severe mental health disorders.   The answer to this second question is no, according to the information in the database.  But the answer to the question that the interviewer had asked was yes (at least for one kind of mental disorder, psychosis).  Apparently the interviewer didn't notice the difference, and followed up by asking "why does the public erroneously link mental illness with mass shootings and with violence in general?"

This could just be a case of miscommunication--anything involving probabilities can be confusing.  However, I think it's an example of a more general problem:  sometimes a focus on making sure that people don't draw the wrong conclusions comes at the expense of explaining what the research actually found.  I first noted this when writing  a post on a study of coffee consumption, where accounts emphasized a point that wasn't supported by the data:  that benefits only occurred with moderate consumption, not high consumption.  I saw another example later in the summer, when a study of diet and exercise was described as showing "that healthy eating and regular workouts do not, in isolation, stave off later health issues. They need to be done together."  In fact, the study suggested exactly the opposite--exercise and diet had additive effects on mortality, and no interactions were found.  The reason seemed to be a goal of getting people to think of exercise as a way to improve one's overall health rather than a way of getting away with a bad diet--"the study highlights the importance of viewing food and exercise as components of holistic health, Dr. Ding said, instead of calculating how many miles can 'cancel out' a cookie."  With mass shootings, there's concern about increasing the stigma against mental illness. As these examples suggest, the problem is more prevalent in medicine and public health, where researchers know that people might use their findings to make decisions.   

Friday, September 30, 2022

The other popular vote

Some observers say that the Republicans remain competitive only because they benefit from features of the American political system such as the Electoral College, equal representation of states in the Senate, and gerrymandering.   For example, this article in the New York Times notes the Democrats have won the popular vote in seven out of the last eight presidential elections and calls it "an unprecedented run of popular-vote success in U.S. history."   However, that's just presidential elections--during the same period, the Republicans have had majorities in the House of Representatives more than two-thirds of the time.  Is because Republicans have done well among voters or because of gerrymandering or clustering of Democratic voters in urban areas?  Nationwide vote totals for congressional elections are not routinely reported, but figures for 1946-2018 can be found in a report by the Brookings Institution

 It turns out that the Democratic share of seats in the House has exceeded their share of the votes in House races in 22 of the 37 congressional elections, but the advantage has shifted.  The figure shows share of seats vs. share of votes in two periods:


1946-1992 elections are in blue, 1994-2018 are in red.  The diagonal line is y=x, that is, share of the seats matches share of the vote.  Most of the points in the first period are above the line, meaning that the Democrats did better in seats than in votes, and most of those in the second period are below.  The Democratic advantage in seats in the first period may have been a result of the "solid South," which involved almost complete suppression of the black vote and low turnout among whites.  That is, the Democrats won a lot of Southern seats with low numbers of votes (even though they had high shares of the vote).  The current Democratic disadvantage probably reflects a tendency for votes to be "wasted" in non-competitive urban districts.  But whatever the reason, Democrats now are usually at a disadvantage in turning votes into House seats.  

The other thing to notice is the red vertical line, which marks equal vote shares.  In the first period, the points are almost all to the right of the line:  that is, Democrats got more votes.  Since 1994, this has changed--Republicans have gotten more votes in most elections.  The next figure shows the ratio of Democratic to Republican votes over time:

The Democratic share generally increased until the mid-1970s, then declined, before levelling off around 2000.  Although the swings in presidential vote shares from one election to the next have been small in the 21st century, swings in vote shares for the House of Representative have been fairly large--the 2010 swing was the largest since 1948.

I don't have any particular conclusion from all this--I just think it's data that deserves more attention.  


Sunday, September 25, 2022

Self-interest, economics, and partisanship

 My last post didn't include any data.  That's because it involves a general framework for interpreting events rather than a specific proposition.  However, when looking at potentially relevant data I found an interesting pattern.  Since the 1970s, the GSS has included the question "Do you consider the amount of federal income tax which you have to pay as too high, about right, or too low?"  About 60% say that it's too high and hardly anyone (about 1%) says that it's too low.  You could say that this shows the importance of self-interest:  .  However, opinions on this issue didn't have much connection to partisanship or other political opinions.    The figure shows the average opinions about tax by party and income groups (the first three are roughly quartiles, and the fourth and fifth are roughly eighths.  There's no connection to partisanship except maybe in the highest income group.  


But that figure only includes data up to 2006.  The relationship has changed, and although I haven't examined it systematically, the change seems to have happened pretty quickly.  


Since 2008, Republicans have been more likely to say that they pay too much tax, and the gap grows with income.  High-income Republicans are the most likely to think that they pay too much (71% say too much, 0.2% say too little).  High income Democrats are the least likely:  37% too much, 10% too little (up from less than 3% in 1976-2006).  So this is an economic issue that has grown in importance.  Another interesting point:  that the averages are lower (more people say that they pay too little or about right) in 2008-21.   So you could say that there's been a move away from self-interest, but not away from economic issues--that people's ideas about fairness make more difference than they used to.  Of course, it's not definitive evidence of anything, but it's consistent with my interpretation from last time.


Thursday, September 22, 2022

Or do they?

 Thomas Edsall recently had a piece that began by asking "Why do millions of Americans on both the right and the left ignore their own economic self-interest when they choose which political party to support?"  His answer was that "Partisan prioritization of cultural and racial issues has, to a notable extent, superseded the economic conflicts that once characterized the nation’s politics..."  This led to a change in the social bases of the parties: "millions of working- and middle-class whites have shifted their focus away from the goal of income redistribution ...to support the Republican preference for traditional, even reactionary, sociocultural values. At the same time, college-educated white voters have come to support tax and spending initiatives that subordinate their own financial self-interest in favor of redistribution and liberal social values."  He went on to say that this shift was the result of economic growth:  as people become more affluent, they can afford the "luxury" of voting on the basis of values rather than self-interest.  

As Edsall noted, this general analysis has been around for a long time.  In 1960, Seymour Martin Lipset said that the working class tended to support parties of the left because of "simple economic self-interest.   The leftist parties represent themselves as instruments of social change in the direction of equality; the lower-income groups support them in order to become economically better off, while the higher-income groups oppose them in order to maintain their economic advantages."  But Lipset also observed that working-class people tended to be more conservative on what we would now call "social issues" like civil liberties and ethnic tolerance.  So the relationship between class and party support would shift depending on the relative importance of economic and social issues.  The overall support for left and right would also change:  the left had an advantage on economic issues because there are more relatively poor people than right ones; the right had an advantage on social issues because it was associated with patriotism and "traditional values."  In the 1970s, Ronald Inglehart added the idea that as their standard of living increased, people would give lower priority to material interests and higher priority to values. Putting those together, you get a model of political change that seems to explain a number of important developments--the gradual shift in the class bases of left and right parties, the rise of a new "woke" left and "populist" right, and the decline of the traditional class-based left.  Edsall suggests that it also helps to explain the growth of inequality (less pressure from the working class to do something about it) and the rise of political polarization--"the displacement of economically based partisan conflict by racial and cultural issue-based conflict has escalated political and social animosity."

I've discussed aspects of this account in some of my academic work and some previous posts.  In this post, I will discuss the its general logic.  Although it certainly contains an element of truth, it goes wrong in treating four things as roughly equivalent:  self-interest, redistribution, economic issues, and class (income) politics.   First, there is a straightforward connection between redistribution and self-interest in the short term, but in the long term, self-interest also involves economic growth, and redistribution may affect growth. The poor person who opposes redistribution and the rich person who favors it can both make a case that they are following their self-interest.  Moreover, those cases don't depend on sophisticated economic analysis--you can put either one in common-sense terms.  Also, the long term doesn't have to be that long--a few years of recession versus strong economic growth can make a big difference.    Second, views of economic issues aren't just a matter of self-interest--they also involve values.  Of course, there is some tendency for ideas of fairness to align with self-interest, but they do matter, both in support for redistribution ("we can't just let people starve") and opposition ("I don't want a handout").  Third, redistribution can occur along many different lines, not just rich to poor.   Redistribution from rich to poor is the most efficient, in the sense that it raises the most revenue while antagonizing the smallest number of people, and that will give it some appeal to vote-seeking politicians.  But other kinds of redistribution are more likely to coincide with existing identities (e. g., ethnicity) or beliefs about fairness (e. g., helping veterans or old people).  So voting in favor of redistribution to yourself may not mean voting on class lines.  

I agree that increasing affluence means that self-interested redistribution becomes less important.  But that doesn't mean that economic issues or the general issue of inequality become less important, and doesn't directly imply anything about class alignments.  What it does mean is that the old style of patronage politics (get something for my constituents) declines at the expense of ideological politics (act on the basis of some principle or theory).  

Lipset's idea that the left does better when economic issues are primary remains popular today.  Moderate Democrats say that the party would do better if it stepped back the "culture wars" and emphasized "kitchen table" issues.  Progressives say that the party would benefit from taking a stand for the working class against the rich and corporations.  I don't think that this is true either--some parts of the traditional program of the left are popular (e. g., minimum wage laws), some are unpopular (e. g. aid to working-age people who aren't working), and some are mixed (e. g., support for unions).  So I don't think that a focus on economics has clear advantages or disadvantages for either side.  

Saturday, September 17, 2022

I don't care if I never get back, part 2

In my last post, I discussed a question about whether you would like to work from home after the coronavirus pandemic was over.  Blacks were more interested in working from home and more educated people were less interested.   The survey also contained some questions about how different aspects of your job had changed since the beginning of the pandemic, so I compared racial and educational groups on these.  An alternative approach would be to look for group differences in the difference between people who reported working from home more than they had before the pandemic vs. those reporting working from home the same (or less, in few cases).  I looked and didn't see much of anything, but given the sample size, there's very little power to detect interactions, especially for race.  However, I think that the simple comparison is meaningful because even people who were not currently working from home had experienced it and in most cases were still affected by it because of having co-workers who were working from home.  That is, the great majority of people in jobs where it was possible to work from home were experiencing a workplace in which people weren't all in the same place at the same time.

 All of the questions had a more/less/the same format, so I summarized them as percent more minus percent less.  

                                       non-black            black

Flexibility in hours             +28                        +18
Job security                          -11                       -5
Balance work/family             -1                        -13
*Connected co-workers        -45                       -22
Opportunities to advance    -16                        -12
Know what's expected         -15                       -9
Productive                             +0                         +3
More hours                          +14                        +16

Satisfied with job                  -6                          +2

The biggest difference (and the only one that is statistically significant) is in feeling connected to your co-workers.  Both blacks and non-blacks say that they are less connected, but the drop among blacks is only about half as large.  One possible explanation is that they felt less connected before the pandemic, so they had less to lose.  But more blacks reported an increase in feeling connected (16% compared to 8%).   It seems likely that remote work led to an increase in the importance of formal relative to informal communications.  That could mean that people who hadn't been near the center of things now felt like they were being consulted more or hearing sooner than they had been.  Blacks also did relatively better in knowing what your supervisor expected, opportunities to advance, and feeling productive, although none of the differences were statistically significant.  So these differences give some support to the account in the New York Times story that I criticized last time--the idea was that remote work meant that blacks could focus on doing the job rather than on trying to break into the "old boys' club."

                                        high school            some college     BA+

*Flexibility in hours             +8                        +18                     +30
*Job security                          -1                       -2                      -15
Balance work/family             -36                       -25                  -50
*Connected co-workers        -36                      -25                   -50
Opportunities to advance    -11                        -14                   -17
*Know what's expected         -3                       -10                    -19
Productive                             +3                         +4                 -1
*More hours                          +4                        +8                   +19

Satisfied with job                  -9                         -0                    -6

For education, there are several statistically significant differences:  more education workers report more increase in flexibility, but more drop in connectedness, knowing what's expected, and job security.  There's little or no difference in reported productivity, but more educated workers report more increase in hours worked.  I would say that the differences in connectedness and knowing what's expected are because interaction at work isn't just a matter of socializing or team-building, as the Times articles suggest, but also sometimes involve exchanging complex information, which is harder to do effectively in remote work.  Exchanging complex information is likely to be a bigger part of the jobs done by more educated workers, which accounts for the differences.  The combination of increased flexibility and increased hours also seems likely to be due to a difference in the kind of jobs:  more educated workers are more likely to have open-ended jobs.  It's also interesting that the relative increase in work hours is almost exactly balanced by a relative decline in job security--if workers are putting in more hours, employers may think they don't need as many.  

Common sense suggests that remote work will have different effects for different people, depending on personality, type of work, family situation, and lots of other things.  Moreover, it's not hard to think of ways in which it could enhance workers' power against employers and other ways in which it could reduce it.  So I'm not sure why the Times has become so attached to an interpretation in which remote work is an unambiguous good.  (Since I wrote my first post, it ran another story about the alleged benefits of remote work, this one saying that people were more productive outside the office).

[Data from the Roper Center for Public Opinion Research]