The AP recently had a story in which they went to "the heart of Trump country," specifically Sandy Hook, Kentucky, "isolated in the foothills of the Appalachian Mountains." Apparently a number of people said they were tired of hearing about the Trump voters in Appalachia mourning for the days when coal was king, according to this story by Philip Bump, and observed that plenty of Trump voters could be found in affluent suburbs. I have made the same complaint myself in the past, but as Bump pointed out, in Elliott County (where Sandy Hook is), there was a large swing to Trump. So if you're looking for people who were attracted to Trump, rather than people who just voted for him because he was a Republican, it's a defensible choice.
I looked more systematically, using these county-level election results for 2012 and 2016. These were compiled by volunteers, so there may be some errors, but I checked some cases and they seemed good. In 2012, the mean county-level Republican share of the vote was 59.8%, and in 2016 it rose to 63.5%. This shows two things--that the Republicans tend to do better in the less populous counties, and that this tendency became stronger in 2016. There are about 3,000 counties in the United States; here is the geographical distribution of the 100 with the biggest pro-Republican swing between 2012 and 2016:
Iowa 21
Ohio 20
Missouri 12
Illinois 6
Indiana 6
Tennessee 6
Kentucky 5
Wisconsin 5
West Virginia 4
Virginia 3
New York 3
Minnesota 3
North Dakota 2
Vermont 1
South Dakota 1
Pennsylvania 1
Vermont 1
Elliott County had the biggest swing. The counties that moved towards Trump were overwhelmingly in the Midwest (broadly defined)--there were only a handful in the Northeast, none on the Pacific coast, and none from any Southern states except Tennessee and Virginia. A significant number are in Appalachia, but most of them aren't. I don't know anything about most of the counties on the list, so I can't offer any thoughts on what they have in common, but it seems like journalists looking for "Trump country" should broaden their focus--in particular, Iowa deserves attention. The one thing I can say is that they mostly had small populations--the biggest was Schuylkill County, PA, whose biggest city is Pottsville (home of some of my ancestors).
I also calculated the counties with the biggest swing to the Democrats. Their distribution:
Texas 18
California 15
Georgia 12
Virginia 11
Utah 8
Arizona 4
Illinois 4
North Carolina 4
Kansas 3
New Jersey 2
Pennsylvania 2
New York 2
Indiana 2
Massachusetts 2
Maryland 2
Arkansas 1
Connecticut 1
Montana 1
New Mexico 1
Ohio 1
Tennessee 1
Washington 1
Wisconsin 1
Wyoming 1
A lot of large cities appeared on the list--Los Angeles, New York, San Diego, San Francisco, and Dallas counties, as well as Harris County (Houston), Fulton County (Atlanta), and King County (Seattle). There were also some affluent suburban counties, like Fairfield (CT), Westchester (NY), Somerset and Morris (NJ), and Johnson (KS). They were less geographically concentrated than the counties with the biggest Republican swings, The shifts were also smaller--the biggest swing to the Democrats was in Parmer County (TX), where the Democratic share went from about 20% to about 30%. There were about 350 counties in which the Republican share increased by more than 10%.*
The one clear thing is that the urban/rural split got bigger, and the urban swing to the Democrats was not just in "blue states." An interesting question is what happened in Georgia--none of the nearby states had nearly as many counties that shifted to the Democrats.
PS: This is a convenient place to look at results for individual counties since 1920.
*If you consider Republican losses, the contrast is less striking--there were a number of counties in Utah and Idaho where the Republican share dropped by 20% or more, presumably because of shifts to Evan McMullin. But it's still substantial--there were only about 40 counties in which the Republican share dropped by more than 10%.
Saturday, December 30, 2017
Monday, December 25, 2017
Christmas bonus
My last post mentioned Trump's approval ratings among college graduates, but didn't show them. Here they are, with a comparison to Obama at the same points in his presidency.


Trump's approval rating at the beginning was almost 30 points behind Obama's (36% vs. 66%). Obama's approval declined substantially during his first year, so the gap has narrowed to 20 points (32% vs. 52%). That's 14 points behind Obama's lowest approval rating (46% at the end of 2013).
I mentioned "style" as a factor in relative approval in my last post, and one of the examples I was thinking of was Trump's blustering about how nations that voted against his policy in the UN had better not come asking for aid. I haven't seen any polling results on this specifically, but I looked for parallels and found a question from 2001: "Do you agree or disagree with the following statement? Countries that receive substantial military or economic aid from the United States should support U.S. positions when casting votes at the U.N." The percent agreeing (of those who had an opinion), by education:
Not HS grad 88%
HS grad 92%
Some college 84%
College grad 74%
Grad educ 69%
Or to put it another way, about 10% of people who didn't attend college disagreed, vs. over 30% of people with graduate education. This survey was taken only a week or two after 9/11, which may have affected the totals--a survey in the mid-1990s found only about 55% agreeing on a similar question. But I doubt that the circumstances would have much effect on the educational difference.
[Source: Roper Center for Public Opinion Research]
.
Saturday, December 23, 2017
Education and presidential approval
During the 2016 campaign, Donald Trump promised a large infrastructure program, major restrictions on international trade, and eliminating tax loopholes that benefited wealthy people. As President, he's followed standard Republican economic policy--cut taxes and regulations on business and try to repeal the Affordable Care Act--and the "populist" elements have been pretty much forgotten.
Has the difference between promises and policies led to a change in the social composition of his support? The Gallup Presidential Job Approval Center has more or less weekly data on presidential approval ratings broken down by various factors. I calculated his average approval rates among people with and without a college degree in the first five surveys of his presidency (Jan-Feb) and the most recent five (Nov-Dec). In the first five, his approval was 44.8% among people without a college degree and 36.6% among people with a college degree, for a difference of 8.2; in the last five, it was 38.4% and 32.0%, for a difference of 6.4. That is, less educated people are still more likely to approve of Trump, although the gap may have closed a little.
I also looked at Obama's approval ratings among people with and without a college degree, using the first five surveys in his presidency, and then the last five in every year of his presidency (including 2009). The results:

Obama's approval rating among more educated people relative to less educated people rose pretty steadily over his time in office. At the beginning, he had only slightly higher approval ratings among college graduates (66% to 64%); by the end, it was a pretty large gap (61% to 53%). It would be interesting to try to figure out the exact timing--was it a gradual shift or did it correspond to some events--but that would take more time than I can afford to spend on this.
This does not mean that Trump is more popular than Obama was among people without a college degree:

Has the difference between promises and policies led to a change in the social composition of his support? The Gallup Presidential Job Approval Center has more or less weekly data on presidential approval ratings broken down by various factors. I calculated his average approval rates among people with and without a college degree in the first five surveys of his presidency (Jan-Feb) and the most recent five (Nov-Dec). In the first five, his approval was 44.8% among people without a college degree and 36.6% among people with a college degree, for a difference of 8.2; in the last five, it was 38.4% and 32.0%, for a difference of 6.4. That is, less educated people are still more likely to approve of Trump, although the gap may have closed a little.
I also looked at Obama's approval ratings among people with and without a college degree, using the first five surveys in his presidency, and then the last five in every year of his presidency (including 2009). The results:

This does not mean that Trump is more popular than Obama was among people without a college degree:

His approval ratings among this group, even at the beginning of his presidency, were somewhat below Obama's average. The striking difference in approval ratings between Trump and Obama is among people with a college degree.
My tentative interpretation is that the differences in relative approval ratings are mostly about style rather than policy, or perceived policy. More educated people are more likely to be concerned about standards of "presidential" behavior--less educated people may see violations of them as harmless or even as refreshing honesty. (See this post for a historical parallel)
Wednesday, December 20, 2017
Confidences
My post on confidence in institutions used data from the Gallup Polls. The General Social Survey also has some questions about confidence in institutions, which are introduced by: "I am going to name some institutions in this country. As far as the people running these institutions are concerned, would you say you have a great deal of confidence, only some confidence, or hardly any confidence at all in them?" One of the institutions is the military. I compared changes the GSS and Gallup questions; since the response scales are different, I standardized both:
 They track each other closely--the correlation is about 0.9. There seems to be some discrepancy in the 1970s and early 1980s--confidence according the Gallup question (which just asks about the institution) is low relative to confidence according to the GSS question. Or you could say that confidence in the military has increased somewhat more than confidence in "the people running" the military. However, this is a secondary issue--basically, they are good substitutes for each other. (Better than I expected--I thought people might make more distinction between the military and the people running the military).
What makes the comparison particularly interesting is the first two points labelled "GSS"--they aren't actually from the GSS, but from the Harris Poll, which introduced the question in 1966 and asked it again in 1971, before Gallup started their question. There was a large drop in confidence in that five year period--after forty years of increase, we are not yet back to the 1966 level. Vietnam is the obvious explanation for the drop, but Harris asked about a number of other institutions, and most of them also saw large declines in confidence. Unfortunately the data from 1966 and 1971 do not seem to have survived, but I was able to find data from Harris Polls in 1967 and 1972 which included the confidence questions, and I will write about them in a future post. Since the semester is finally over, the "future" might even be the near future.
Note: the figures for the Harris data were obtained from Lipset and Schneider, The Confidence Gap, and an article by Everett Ladd in the 1976-7 issue of Public Opinion Quarterly.
Saturday, December 9, 2017
What about the wall?
In a number of posts, I have argued that opposition to immigration is not primarily a cover for racial prejudice--it's an issue in its own right. There are substantial race/ethnic differences on immigration issues today. In August 2016, Pew asked "All in all, would you favor or oppose building a wall along the entire border with Mexico?" 43% of non-Hispanic whites were in favor, compared to only 19% of blacks and 22% of Hispanics. But in 2006, a Gallup/USA Today poll asked "Do you favor or oppose each of the following proposals as a way to reduce illegal immigration to the United States? How about... building a wall along the border with Mexico?" 40% of non-Hispanic whites were in favor, as were 53% of blacks and 40% of Hispanics. The differences as a whole were not statistically significant, although if you just consider the black/white difference it was borderline.
What happened in those 10 years? The most straightforward explanation is that building a wall went from an idea that didn't receive serious attention to the favorite policy of the Republican candidate for president, and something that all prominent Democrats condemned. Blacks and Hispanics are overwhelming Democrats, so they followed their party (or reacted against the party they disliked).
PS: I got the idea for this post when I read something that said Donald Trump was a "white nationalist" and mentioned the wall as one of the pieces of evidence for this. I couldn't remember exactly where, but I did a search for the phrase in the New York Times and got the following results:
Years frequency
1900-1999 24
2000-2013 22
2014 4
2015 9
2016 95
2017 263
[Data from the Roper Center for Public Opinion Research]
Thursday, December 7, 2017
Another year
Andrew Gelman had a link to my post about declining confidence in institutions, so I will give an update. First, since I was interested in trends, I just considered institutions for which there was twenty or more years of data. "Small business" narrowly missed, and does qualify this year, so here it is (along with the military and the police, which have similar levels of approval):

I think the 1994 figure is underestimated (or else everything else is overestimated), but even if you set them aside there seems to be an upward trend. Next, here is the change from 2016 to 2017:
Newspapers +7
Schools +6
Banks +5
Labor +5
Supreme Court +4
Criminal Justice +4
Military +2
TV news +3
Big business +3
Congress +2
Police +1
Religion 0
Medicine -2
Presidency -4
Small business -5
Eleven institutions improved, and only three declined. Differences of about 5 or more are statistically significant.
Finally, a possible explanation of confidence in the military is that it rises and falls depending on success or failure. That's probably a factor, but I don't think it's the whole story. In 1993, a couple of years after the success of the first Gulf War, 67% had a great deal or quite a bit of confidence in the military. In 2017, after long and inconclusive engagements in Iraq and Afghanistan, 75% did. I think that there has been a more general change, which Andrew Bacevich has talked about: the military doesn't ask much of the general public, and in return we don't ask questions.
[Additional data from the Roper Center for Public Opinion Research]
Wednesday, November 29, 2017
Make America Well-informed Again?
In the New York Times, Timothy Egan laments American's ignorance about government and public affairs, and says that things used to be different: "we have allowed the educational system to become negligent in teaching the owner’s manual of citizenship. . . . up until the 1960s, it was common for students to take three separate courses in civics and government before they got out of high school."
It's not hard to find examples of widespread ignorance in recent years. For example, in 2001 the Gallup Poll asked "What are the first 10 Amendments to the Constitution called?" 57% said the Bill of Rights, 6% gave an incorrect answer, and 37% said they didn't know. When Gallup asked the same question back in the good old days (more specifically, in 1954), 33% said the Bill of Rights, 2% gave an incorrect answer, and 65% said they didn't know. Knowledge didn't decline between 1954 and 2001--it increased.
What about those civics courses students had to take in order to graduate? At the time, many people didn't graduate from, or even attend, high school. In the 1954 sample, about 32% had an 8th grade education or less and 24% had attended high school but not graduated. That is, only a minority were high school graduates. The percent giving the correct answer by educational level:
1954 2001
HS or less 27% 38%
Some College 60% 61%
College graduate 74% 78%
The 2001 report didn't give a more detailed breakdown of education, but in 1954 46% of people who had graduated from high school and had no college got it right. So within each educational level, there was little or no change between 1954 and 2001. Regardless of what people study in school, more educated people are more likely to follow the news, which means they are more likely to pick up new information and less likely to forget the things they once knew.
[Data from the Roper Center for Public Opinion Research]
Wednesday, November 22, 2017
Four more years
In a recent post, I referred to a post on changes in response to the question "What do you think the chances are these days that a white person won't get a job or promotion while an equally or less qualified black person gets one instead? Is this very likely, somewhat likely, or not very likely to happen these days?" It occurred to me that the post was from 2013 and the question is from the General Social Survey, which is conducted in even-numbered years. So now data from 2014 and 2016 are also available, and a lot has happened in those years.
There are three possible responses: very likely, somewhat likely, and not very likely. The figure shows a summary measure of opinions (among whites--I also tried limiting it to non-Hispanic whites but it was about the same) since the question was first asked in 1990, plus upper and lower bounds of the 95% confidence interval--higher numbers mean less likely.

Opinions have moved steadily in the direction of seeing less chance that whites lose out to blacks--the correlation between year and the summary measure is over 0.9. In 1990, about 28% said "very likely" and 30% "not very likely"; in 2016 13% said "very likely" and 39% "not very likely."
The movement has not been completely uniform--there was clearly a shift towards seeing it as more likely in 1994, and probably in 2002 and 2006 as well. But the movement from 2008-16 was right on the trend, despite the election of a black president, the Black Lives Matter movement, and the Trump campaign.
Thursday, November 16, 2017
Revise and resubmit
After reading my last post, my esteemed friend Robert Biggert urged me to take a look at rates of immigration, and pointed to this column by Thomas Edsall, which argued that there was a turn towards Trump in places where there were few immigrants but the number was increasing rapidly. Then this morning I saw another by Edsall which argued that there was a turn towards Trump in places where there were few "minorities" but the number was increasing rapidly. The idea is that whites feel most threatened when they are first exposed to a significant number of "others." After reading the first one, I got figures on the number of foreign-born people by state in 2000, 2010, and 2015. I found the 2000-10 changes didn't make any difference to 2016 vote, but the 2010-15 changes did. So I decided to limit my attention to changes in the black and Hispanic population since 2010. The results from regressions with Republican gain over 2012 as the dependent variable (standard errors in parentheses):
Constant .026 -.062
(.013) (.030)
Utah -.145 -.135
(.021) (.019)
Home -.040 -.046
(.017) (.015)
Black (2010) -.109 -.088
(.028) (.026)
Hispanic (2010) -.131 -.096
(.042) (.038)
Foreign-born (2010) -.084 -.041
(.076) (.068)
Disability .437 .649
(.248) (.226)
Grow10-15 .023
(.0063)
Adj. R-square 74.5% 75.4%
The last variable is the sum of the growth in black, Hispanic, and foreign-born population. For each one, "growth" is the ratio of 2015 share to 2010 share. The reason I used the sum is that when growth in each population was included separately, the group was statistically significant, but none of the individual estimates were. Almost by definition, the largest values for growth occurred in places that had few "minorities" in 2010: the states that ranked highest on Grow10-15 were North Dakota, South Dakota, Maine, Vermont, and Minnesota. But the estimates for percent black and Hispanic in 2010 are still negative and statistically significant, so the conclusions from my previous two posts stand up. (The estimate for foreign-born is negative although not statistically significant). Going back to the "defense of whiteness" idea, these analysis suggest in the contemporary United States it's a temporary thing--it applies when "others" are first appearing but weakens or reverses as they remain.
Saturday, November 11, 2017
and why were they there?
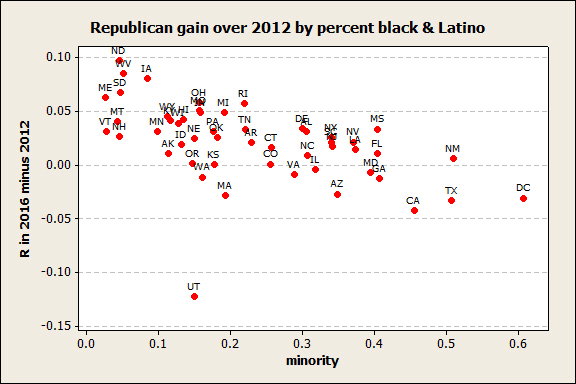
As I said in my last post, Donald Trump did better than Mitt Romney had in states with few "minorities" (blacks or Hispanics) and worse in states with large numbers of "minorities." I have read a lot of articles about the 2016 election, but don't recall anyone noticing this. In a post from December 2016 I noted that some of Trump's biggest gains took place in states with few minorities, but I didn't follow up on it. Here is a figure showing gain or loss over 2016 by percent black or Hispanic. The correlation is about 0.5 for all states and 0.7 if you exclude Utah. I don't think that it's likely to go away if you control for other factors, so how should it be explained?

One popular analysis of the 2016 election was that it was about the defense of "whiteness," which is a mixture of prejudice and the rational (although selfish) defense of group interests. People who advocate this don't pay much attention to regional differences--they generally focus on making a case that there's a historical pattern of white backlash after every move towards racial equality. But it seems that this account implies regional differences too. Racial interests will make more difference to white voters if the percentage of racial minorities is larger: that is, minorities will be more of a threat where they are more numerous. To the extent that Trump appealed to "whiteness," he should have gained more where the percentage of minorities was higher. That is the opposite of what happened.* So how can this pattern be explained? The assumption of the usual account is that an appeal to "whiteness" will gain votes among whites. But white opinions on race have changed a lot over time. The decline in straightforward prejudice is well known, but whites have also seem to have become less likely to think that they are the ones who are discriminated against. That suggests that an increasing number of whites will have a negative reaction to a "defense of whiteness" appeal--they will regard it as unfair. Even whites in the middle--those who don't think there's much discrimination against either blacks or whites--may have a negative reaction because they think it will increase racial conflict.
So my view is that to the extent that Trump appealed to "whiteness," that hurt him in much of the country. The thing that helped him was an appeal to nationalism, as discussed in this post, among others.
*Another variant of this analysis is that Trump was no different from Romney, Bush, etc.: they all appealed to "whiteness" and he was just cruder. But this would imply no relationship.
Sunday, November 5, 2017
Where were they?
By and large, the states in which Trump did well in last year's election were the states in which Mitt Romney did well in 2012. The figure shows the Republican share of the Democratic plus Republican vote in the 2012 and 2016 election (the District of Columbia is not shown because it is off the scale).


Still, there were some shifts, and they made a difference to the outcome. What sort of states shifted towards the Republicans? One possibility is that it was ones that were struggling economically. I saw a lot of stories about Midwestern cities where factories had closed down, or were threatened with closure, and people turned to Trump. Another possibility is that it was places that were suffering from high levels opioid addiction--people could think that "get tough" policies were needed or just that the Obama administration hadn't been successful in dealing with the issue, either of which would help Trump. High rates of disability could produce sentiment against "unworthy" beneficiaries of government programs (I proposed something along those lines in this post). Although people sometimes talk like all of these go together, they are not all that highly correlated at the state level--the correlation between deaths from drug overdose and percent of the working-age population receiving disability benefits is about 0.4, and the correlations of the unemployment rate with overdoses and disability are both about 0.2. Some regressions of the Republican share of the two-party vote in 2016 on these three variables plus various controls (t-ratios in parentheses).
u od d Controls
1. .006 -.0005 .013 2012
(-1.2) (-0.6) (3.4)
2. -.0098 .0006 .006 plus Utah
(-2.5) (1.0) (1.9)
3. -.012 .001 .006 plua home state
(-3.2) (1.6) (2.1)
4. -.001 .0004 .004 plus % black, % Hispanic
(0.3) (0.8) (1.4)
5. .005 same as #4
(2.1)
Utah was an outlier, and there was an obvious reason for that--independent conservative candidate Evan McMullin, who was a native of Utah and a Mormon, got over 20% of the votes there. "Home state" was defined as +1 for Massachusetts and -0.5 for Illinois and Hawaii. Both 2016 candidates were residents of New York, so only 2012 needed to be considered. When dealing with American politics, it's always advisable to consider race and ethnicity, so I put in controls for black and Hispanic.
Considering all of the regressions, it's clear that Trump did not do relatively well where the unemployment rate was high. The rate of overdose deaths and disability always had the same sign, but disability was consistently stronger, so in the last regression I just considered disability. The estimate is statistically significant, although not overwhelmingly so. The disability rates range from about 3% to about 9%, so going from low to high is estimated to increase Trump's share by .03 (relative to Romney in 2012). That's enough to be of interest.
However, the effects of percent black and Hispanic, which I just threw in as controls, were much more substantial. In states where there were few blacks and Hispanics, Trump generally did better than Romney had; in states with lots of black and Hispanics, he generally did worse. The estimates were both negative and of similar size--if you combine them into a single "minority" proportion, the estimate is about -.13, and going from the states with the lowest percent minority to the highest (Texas and New Mexico) would reduce Trump's share by about .07.
Black voters are overwhelmingly Democratic everywhere; Hispanic voters are pretty heavily Democratic and Trump actually did a little better among them than Romney did, according to exit polls. Black turnout was probably down from 2012, but Hispanic turnout was probably up. So it seems likely that most of the shift resulted from changes among white voters.
I will offer some thoughts on the meaning of this pattern in my next post.
Sunday, October 29, 2017
Evidence
I looked for surveys that were relevant to the issues discussed in my last post, and found one sponsored by CNN and conducted by the Opinion Research Corporation in 2010. It included a series of questions on whether people favored or opposed:
a. Building a 700-mile long fence on the border with Mexico
b. Creating a program that would allow illegal immigrants already living in the United States for a number of years to stay here and apply to legally remain in this country permanently if they had a job and paid back taxes
c. Imposing fines of tens of thousands of dollars on employers who hire illegal immigrants
d. Sending employers who hire illegal immigrants to jail
e. Putting more Border Patrol and federal law enforcement agents on the U.S. border with Mexico
The distribution of opinions:
Favor Oppose Mixed/DK
Fence 45% 55% 1%
Stay 83% 17% 0%
Fines 62% 38% 1%
Jail 41% 59% 0%
Border 78% 21% 0%
The survey also contained a series of questions asking about whether certain statements apply to immigrants moving here in the past ten years:
a. Are basically good, honest people (82% say yes)
b. Add to the crime problem (58% yes)
c. Take jobs away from Americans (52% yes)
d. Are hard-working (87% yes)
e. Are a burden on American taxpayers (65% yes)
Questions a, c, d, and e from the first group all involve enforcement of immigration laws. If you add them together to get an index of support for more vigorous enforcement and regress them on the views of immigrants, all have a statistically significant relationship except the first. That is, there is no evidence that whether or not people think most immigrants are "basically good, honest people has any connection to support for stronger enforcement (the t-ratio is about 0.4) of policies against illegal immigration. If you regress the "path to citizenship" question (b) from the first series on the same views of immigrants, "basically good, honest people" has a significant relationship (t=3.2), and appears to be the second or third strongest predictor, depending on how you measure. That is, views of the character of immigrants matter for opinions about whether they should be allowed to stay, but not (or not nearly as much) for opinions about stronger enforcement of the immigration laws. This pattern illustrates a point I've made before, which is that there are (at least) two immigration issues, and that people who favor stronger enforcement of immigration laws are not necessarily "anti-immigrant" in a general sense.
I didn't find any survey questions that directly involved rights to immigrate or exclude immigrats, but an opinion piece appeared in the New York Times today (it's been online for a few days) about unaccompanied children fleeing violence in Central America and trying to enter the United States. There are currently about 350 reader comments, and I looked at the ten most liked ones. None of the them questioned the individual accounts or said that they represented only a small fraction of illegal immigrants. Nine offered some variant of "the United States can't (or doesn't have an obligation) to take in everyone"--the other one said that Mexico was the closest neighbor, so they had the primary responsibility to help. Although the most liked comments have no value as a measure of the general distribution of opinions, I think they say something about how people explain the opinions they have.
[Data from the Roper Center for Public Opinion Research]
Tuesday, October 24, 2017
The policy that dare not speak its name
A summary of public opinion on immigration:
1. Strong majorities think that people who were brought here as children should be allowed to become citizens. Majorities say that people who came as adults who have been working and don't have a criminal record should at least be allowed to stay, and possibly to become citizens.
2. Opinion is now pretty evenly divided on whether the level of legal immigration should be increased, reduced, or kept the same.
3. Large majorities say that immigration laws should be more strongly enforced about people who are now trying to come in.
That is, give a break to people who are currently here, but try to stop further illegal immigration. The policy of the Obama administration was pretty much in line with prevailing public opinion--he supported a proposal for a "path to citizenship," established DACA, left the laws on legal immigration alone, and deported a lot of people. However, he didn't say much about the deportations. The attention came from critics, mostly on the left, but including Donald Trump in one of the debates: "President Obama has moved millions of people out. Nobody knows about it. Nobody talks about it. But under Obama, millions of people have been moved out of this country. They've been deported." Hillary Clinton said even less about them--as I recall, she just ignored Trump's statement. Why not talk about a policy that would be popular and refute Trump's claims about how we had "open borders"? There were some immediate reasons, which are discussed in this article. But I think there was also a deeper reason.
In popular moral thinking, nations are important. We have obligations to other members of our nation that we don't have to people in other nations. That raises the question of who is a member of our nation. Regardless of their views on what the right level of immigration should be, the great majority of people would agree that "we" (the current citizens) have a right to decide on their number and the conditions of joining our nation. If you asked people to give reasons for these beliefs, I think most would say that they are just common sense.
What you could call "sophisticated" thought is not satisfied with appeals to common sense--it demands justification in terms of principles. Sophisticated thought is not limited to intellectuals in a narrow sense--it also includes most journalists and politicians, and a significant number of educated people more generally. The major principle that is accepted today is human rights: people are endowed with certain inalienable rights, among which are life, liberty, and the pursuit of happiness. Nations and governments are just a means to secure these individual rights. Living where you want is a basic part of liberty and the pursuit of happiness, so on a straightforward interpretation of this principle, it's hard to justify any restrictions on immigration. At the same time, most sophisticated people also share the intuitive sense that the nation is more than just an instrument for securing individual rights. By and large, they deal with this conflict by avoiding it: Democrats denounce anti-immigrant policies but don't say much about what they think immigration policy should be, and Republicans call for the "rule of law" but don't try to give a justification for those laws.
I can't offer any direct evidence for any of this, but I think it is a way to make sense of a number of things about public opinion and politics today.
Tuesday, October 17, 2017
Raise the bar?
A paper published in Nature Human Behavior proposes changing "the default P-value threshold for statistical significance for claims of new discoveries from 0.05 to 0.005"--in terms of t-ratios, from about 2 to 2.8. The paper seems to have been written with experimental social psychology in mind, but its 72 listed authors include economists, political scientists, and sociologists. They are a distinguished group--the sociologists are from the University of Pennsylvania, Univ of North Carolina, Michigan, Harvard, Princeton, and Stanford.
The core argument of the case is about the chance of "false positives." The great majority of the hypotheses proposed in the social sciences are of the form "x is associated with y" (controlling for other factors relevant to y). If the observed data would be unlikely under the "null hypothesis" that "x is not associated with y" (controlling for other factors), you count it as support for the hypothesis that "x is associated."
Suppose that for every ten proposed hypotheses that are true, there are 100 that are false. Using a .05 level means that we can expect a statistically significant association for five of the false ones. Suppose a statistically significant association is found for 80% of the true hypotheses, which is the target that people usually aim for in designing experiments; then 5 out of 13, or almost 40% of the statistically significant associations will represent false hypotheses. Their idea is that researchers should change the standard of statistical significance to 0.5% and continue to aim for 80% power (which would mean bigger experiments). That would mean there would continue to be 8 statistically significant associations that represent real ones but only 0.5 (6% of the total) that are spurious.
The ratio of true to false proposed hypotheses is crucial here. If it's 1:1, then with 80% power and a 5% significance level, we have only 6% spurious associations. The authors offer some evidence that the ratio is about 1:10 for psychology experiments, and say that a "similar number has been suggested in cancer clinical trials, and the number is likely to be much lower in biomedical research." They also address the possible objection that the "threshold for statistical significance should be different for different research committees." They say that they agree, and that genetics and high-energy physics have gone for a higher standard--a t-ratio of about 5, but don't even address the possibility that a lower standard might be appropriate. That is, they seem to take a 10:1 ratio of false to true hypotheses as the minimum, and recommend the .005 standard as a baseline suitable to all fields. They return to this point in the concluding remarks, where they say that since the .05 level was established "a much larger pool of scientists are now asking a much larger number of questions, possibly with much lower prior odds of success." This isn't convincing to me. In the papers I read (published or for review), most of the hypotheses about relations between variables seem pretty plausible. Even if I don't find the reasoning that leads to the prediction convincing, and often I don't, it's not hard to think of an alternative argument (or several arguments) that leads to the same prediction. The idea that more scientists asking more questions means lower prior odds of success isn't compelling either. In some fields, theory has developed, and that should let you make reasonable predictions on more questions. In others, there's at least more evidence, meaning more examples to draw on in making predictions. So I doubt there is a tendency for the prior odds in favor of proposed hypotheses to decline.
If they were just making a suggestion about how to interpret the .05 significance level, I would not object, and in fact would generally agree (see my book Hypothesis Testing and Model Selection in the Social Sciences). But realistically, a "default" of .005 would mean it would become difficult to publish work in which the key parameter estimates were not statistically significant at that level, just as it's now difficult to publish work in which the key parameter estimates aren't significant at the .05 level.* That would be a loss, not a gain, especially with non-experimental data, where a bigger sample is usually not an option.
*They say results that didn't reach .005 "can still be important and merit publication in leading journals if they address important research questions with rigorous methods," but I'm confident that the great majority of reviewers and editors would say that about the .05 level today. Importance and rigor are matters of judgment, so there's usually disagreement among reviewers; the "default" level of significance is objective, so it takes on outsize importance.
Wednesday, October 11, 2017
Then and now
Ta-Nehisi Coates has a piece called "Civil-Rights Protests Have Never Been Popular," in which he notes that in 1966, 63% of people polled had a negative opinion of Martin Luther King. The question was asked five times by the Gallup Poll, asking people to rate him on a scale of +5 to -5. A summary of the results, plus some historical events:
+ - -5
May 1963 41% 37% (20%)
March on Washington 8/1963
Aug 1964 44% 38% (22%)
Selma march, 3/1965
May 1965 45% 46% (27%)
Chicago open housing movement, mid- 1966
Aug 1966 33% 63% (39%)
Aug 2011 95% 4% (1%)
During King's life, there was always a significant number giving him the lowest possible rating, which I show in parentheses.
There are some complications, which I will discuss in the future, but Coates is right in his general point--King was not particularly popular when he was alive, and among whites negative views probably always outnumbered positive views. Strongly negative views were definitely more common than strongly positive views.
[Data from the Roper Center for Public Opinion Research]
Friday, October 6, 2017
A hypothesis
For some reason that I don't recall, I looked at Edward Banfield's The Unheavenly City Revisited (1974) the other day and ran across this passage, about what he thought was an increasing influence of the middle and upper classes in political life:
"The upper-class ideal . . . requires that issues be settled on their merits, not by logrolling, and that their merits be conceived of in terms of general moral principles that may not, under any circumstances, be compromised. In the smoke-filled room, it was party loyalty and private interests that mainly moved men; these motives always permitted 'doing business.' In the talk-filled room, righteous indignation is the main motive, and therefore the longer the talk continues, the clearer it becomes to each side that the other must either be shouted down or knocked down."
Except for the "knocked down," this seems like a good description of the direction of change in American politics since the time he wrote. On the other hand, there is an argument, backed by a good deal of evidence, that increasing levels of education promote stable democracy: education increases openness to new ideas and ability to see the other person's point of view (see this article for references and more discussion). So it doesn't seem that Banfield's hypothesis could work as a general rule, but maybe it applies under some circumstances. One obvious possibility is that the effect of education changes directions--up to a point, increases lead to more willingness to compromise, but beyond that point they reduce it. There's no systematic evidence of this at the individual level, but it fits with some claims about the politics of intellectuals (see the article referenced above). Another possibility, which I think is more likely, is that there is some kind of interaction between social conditions and the political system. That is very vague, but it seems worth thinking about.
Saturday, September 30, 2017
The secret of his success
Donald Trump's overturn of the DACA program has been unpopular, and reaction to the Cotton-Perdue plan to change immigration law has been lukewarm. The lack of enthusiasm is not surprising: surveys show strong support for allowing people who were brought here as children (or even adults who have been here for a while) to stay, and a fairly even division of opinion on whether the number of legal immigrants should be reduced . Immigration was Trump's signature issue--did it actually help him? And if so, how?
I think the answer can be found in a survey sponsored by CNBC and conducted in late October 2016. It asked "If Donald Trump/Hillary Clinton is elected president, do you think the number of illegal immigrants who come to the United States will increase, stay about the same, or decrease?" The results:
Clinton Trump
Increase 42% 6%
Same 45% 31%
Decrease 10% 61%
In 2009, a CNN/ORC poll asked "Would you like to see the number of illegal immigrants currently in this country increased, decreased, or remain the same?" Only 3% wanted to see it increased, and 73% wanted a decrease. So Trump had a big advantage on this issue. By comparison, here is what people expected on some other things that Trump had talked about.
"If ... do you think your federal income taxes would increase, stay about the same, or decrease? "
Clinton Trump
Increase 43% 29%
Same 42% 42%
Decrease 6% 19%
"If ... do you think that our trade agreements with other countries will become more favorable to US interests, stay about the same, or become less favorable to US interests?"
Clinton Trump
More favorable 19% 32%
Same 45% 18%
Less favorable 28% 41%
There was also a question on "which candidate for president would you say has the better policies and approaches to ...Increase your wages," and 46% said Clinton, against 32% for Trump.
It seems that most people thought that Trump would vigorously enforce existing immigration law and Clinton would not. The Republican platform talked a lot about the need to enforce the law--"our highest priority, therefore, must be to secure our borders and all ports of entry and to enforce our immigration laws"--and said nothing about changing them. Trump frequently talked about how we had "open borders" and "people pouring across the border." Clinton and the Democrats did little to counter this picture. The Democratic platform spoke of "our broken immigration system" and talked about the need for "comprehensive immigration reform," but their only comment on enforcement was that it "must be humane and consistent with our values." This raises a question of why they didn't point to the substantial rise in deportations under the Obama administration. I will take that up in a future post.
[Data from the Roper Center for Public Opinion Research]
Monday, September 25, 2017
The owl of Minerva, part 3
In May I had a post about factors associated with support for Donald Trump in the presidential election. This post elaborates about one of those factors, income. I used American National Election Studies data to do a series of (binary logistic) regressions on income controlling for various factors. Here are the estimated effects of income, with a positive sign meaning that higher income goes with a greater chance of voting for Trump:
Controls estimate se
1. none .007 .005
2. black, white,
Hispanic, other -.014 .006
3. plus gender -.016 .006
4. plus education .000 .006
5. plus married -.013 .007
So conclusions about the effect of income depend on what you control for. If you just compare people with higher incomes to people with lower incomes, it seems those with higher incomes were more likely to vote for Trump. But if you compare people of the same ethnicity, gender, education, and marital status, it seems those with higher incomes were less likely to vote for Trump. I think that the second comparison is more meaningful, because we know that ethnicity, education, gender, and marital status made a difference in voting. However, income doesn't make much difference either way, and is not statistically significant in 1, 4, and 5 (which is why I just say "it seems"). The income variable had 28 categories, and an estimate of -.013 means that going from an income of 25-27,000 (category 8) to 100-109,000 (category 23) would change the probability of supporting Trump vs. Clinton from .5 to .452.
By comparison, here are the estimates for the other control variables:
White 0.73
Black -2.32
Hispanic -.90
Female -.19
Education -.15
Married .63
Education had 16 categories, and the impact of going from a high school graduate with no college (9) and a college graduate (13) was 4*.15=0.6, which is bigger than the impact of going from the lowest to highest income categories (28*.013)=.36.
The basic conclusion is that income was not an important factor in the choice between Trump and Clinton; education was. This is not surprising, given what is known about the relationship between education and political opinions. What is surprising for me is that marital status was also an important factor--the difference between married and unmarried people was about the same as the difference between college graduates and people with just a high school diploma. I knew that marital status was a factor in Democratic vs. Republican support in recent elections, but thought that it was on the same order as gender.
PS: Data from exit polls shows some increase in support for Trump as income increases. The difference between the ANES and exit poll data is statistically significant. My guess is that the ANES estimates are more accurate, partly because the response rate is probably higher, and partly because the exit poll sample is not designed to be representative with respect to anything except which candidate people voted for. The practical reason I use ANES data is that the individual-level data for the exit polls hasn't been released yet. But it's safe to say that controlling for the factors discussed here would push the exit poll estimates towards zero.
Tuesday, September 19, 2017
They did it their way
Since my last post was long and complicated, I thought I should follow with something short and simple. In 1987, the Roper Organization asked "Thinking about the way your own life has turned out so far, would you say it has been primarily a matter of luck or fate, or has it been more a matter of factors which are within your control?" The same question was asked in CBS News polls in 1996 and 2016. The results
Luck Your Control Both DK
1986 22% 66% 9% 3%
1996 18% 72% 6% 4%
2016 27% 60% 9% 4%
The differences in the relative frequencies of luck and own control are statistically significant. It seems possible that opinions on this are affected by economic conditions--when people experience bad things like unemployment or reduced income, they are likely to say it's luck. However, as I recall economic conditions in 1986 and 1996 were roughly like they were in 2016--pretty good but not outstanding.
[Data from the Roper Center for Public Opinion Research]
Sunday, September 17, 2017
More old news
About six months ago, I saw several stories saying that "Having just one black teacher can keep black kids in school," to quote NPR's summary. They all noted the magnitude of the effect: almost 40% reduction in dropout rates for low-income black boys. I located the paper on which the stories were based and thought about posting on it, but it was a long paper by the time I got around to reading it, the attention seemed to have passed. However, last week's NY Times magazine had a list of statistics on education, and one of them was "exposure to at least one black teacher in Grades 3 to 5 reduced the probability of low-income black male students dropping out of school by almost 40%." So that led me back to the paper.
The thing that originally attracted my attention was not the general idea that having a black teacher would help to keep black children in school, which seemed plausible, but that it could reduce dropouts by 40% for any group. There is a lot of data on basic educational outcomes like finishing school, and by the standards of social science it's high quality data. Moreover, there are a lot of people who have studied the issue, so it seems that any simple and straightforward way to dramatically reduce dropout rates would have been discovered long ago.
The paper reports that the estimated effect on dropout rates is -.04 for all black students, -.06 for persistently low-income black students, and -.12 for persistently low income black male students. Since about half of students are boys, that suggests that the estimated effect on persistently low income black female students would be about zero, and indeed they report an estimate of 0.00 for that group. So the issue was treating only the big estimate as worthy of interest. If you believe that there are differences in the effects on boys and girls (and the difference appears to be statistically significant), both of the estimates are equally important; if you don't, you should just report the estimate for boys and girls combined. The differences between persistently low income students and other students don't appear to be statistically significant (it's hard to tell from the tables), so maybe you should just report the estimate for all students.
There's also a more complex issue which relates to the way that they got the estimate. The simple approach would be to do a regression with dropping out as the dependent variable, and having a black teacher plus some other variables as independent variables. But the authors say that those estimates "are likely biased by unobserved student characteristics that jointly predict classroom assignments and long-run outcomes, even after conditioning on the basic socio-demographic controls in X and school FE (Rothstein 2010). For example, students with lower achievement (Clotfelter, Ladd & Vigdor, 2006) and greater exposure to school discipline (Lindsay & Hart, 2017) are more likely to be matched to black teachers, and these factors likely affect long-run outcomes as well." That is, black teachers tend to be given the kind of students who are at higher risk of dropping out. The authors had an idea on how to eliminate this potential bias. They had multiple students from each school, which means that they could include a dummy variable for each school. That's a reasonable thing to do, since it's generally agreed that some schools are more effective than others. They also had five different classes of students: those who started third grade in 2000, 2001, 2002, 2003, and 2004. Because of new hires, departures, and leaves, the percent of the teaching staff that was black could change from year to year. Those personnel changes would depend on idiosyncratic individual factors--getting pregnant, reaching retirement age, having a spouse get a job offer in another state--so they would be random from the point of view of the students. So you can use within-school variation in the racial composition of the teaching staff over time as a substitute ("instrument") for the original variable (having a black teacher or not) and get unbiased estimates.
This approach strikes me as clever but not very convincing. Teachers' decisions to stay or go will depend partly on how rewarding it is to work in a school. That could depend on student performance (teachers like it when their students do well) or on things that might affect student performance, like discipline problems, or how well teachers get along with the administration. Things get more complicated because what matters is differential effects on black and white teachers, but I can think of possibilities here too: for example, black teachers may be particularly interested in how the black students are doing. I think I might trust the simple results more than the results from their method--at any rate, I'd like to see them, but they aren't reported in the paper.
This isn't a straightforward mistake, but the sort of difference of judgment that often comes up with research, and the authors could probably say more in defense of their approach. But I will stick with my original feeling that a 40% reduction in dropout rates for anyone is too big to be believed.
Saturday, September 9, 2017
Alternate history
This came up several weeks ago, but I hadn't gotten around to posting on it. On July 26, Elizabeth Hinton (a professor of History and African-American Studies at Harvard) reviewed three books on race and policing in the New York Times. She said that one of the books (Chokehold, by Paul Butler), "demonstrates that when citizenship rights are extended to African-Americans, policy makers and officials at all levels of government historically used law and incarceration as proxy to exert social control in black communities. Black Codes, convict leasing and Jim Crow segregation followed Emancipation; overpolicing and mass incarceration followed the civil rights movement." This reminded me of the figures on crime and prison that I showed in a previous post. I concentrated on crime rates there, so here is more detail about imprisonment. First, the figure for 1929-86, which was the period covered in the data source (it kept going up after 1986):

The next one focuses on the period during and after the civil rights movement:

The rate of imprisonment didn't start rising until 1973, when the movement had either faded away or become mainstream (that is, not really a "movement"). During the period of peak activity of the civil rights movement, the rate of people in prison declined or stayed about the same, although crime was increasing. In a literal sense, the rise in imprisonment did follow the civil rights movement, but the suggestion of cause and effect is not very credible.
Saturday, September 2, 2017
Respect
The Pew survey I mentioned in my previous post had a series of questions about "how much respect do you think Donald Trump has" for various groups "a great deal, a fair amount, some, or none at all." Then the same questions were asked about how much respect Hillary Clinton had for the groups. The averages, ranked from greatest to least average respect for the group:
Trump Clinton
White people 3.23 3.03
Men 3.21 2.77
Veterans 2.84 2.73
Women 2.19 3.16
Blue collar workers 2.64 2.66
Black people 2.31 2.84
Evangelical Christians 2.66 2.42
Hispanic people 2.16 2.85
Immigrants 2.00 2.93
Muslims 1.86 2.93
People who support [opponent] 1.91 1.91
The standard errors are about .03 or .04. The ratings aren't surprising--Trump is seen as having substantially less respect for women, black and Hispanic people, immigrants, and Muslims, and somewhat more respect for white people, men, veterans, and evangelical Christians. However, it's noteworthy that Trump and Clinton are rated almost exactly the same in respect for blue collar workers--this is one of many pieces of evidence that contradicts the popular story that working class voters turned to Trump because they thought that liberals were condescending to them. It's also notable that Clinton was seen as having pretty high respect across the board--her perceived respect for Evangelicals, which was lower than her perceived respect for any group except Trump supporters, was higher than Trump's perceived respect for six of the groups.
What difference did these perceptions make? I regressed intended vote on each candidate's perceived respect for the groups (one half of the sample was asked about women, men, whites, blacks, Hispanics, and veterans; the other about Muslims, evangelicals, immigrants, blue collar workers, and people who supported the other candidate). The logistic regression coefficients, with positive values meaning that more perceived respect for the group goes with more support for the candidate (standard errors are typically about .2 or .3, and standard errors of the differences about .3):
Trump Clinton
White people -0.31 -0.03
Men 0.12 -0.09
Veterans 0.66 1.14
Women 1.13 0.32
Blue collar workers 1.10 1.19
Black people 1.17 1.06
Evangelical Christians 0.34 0.91
Hispanic people 0.74 0.62
Immigrants 0.57 0.04
Muslims 1.53 0.72
People who support [opponent] -0.13 0.77
I don't think that perceptions of respect are necessarily causes of the way that people vote: to some extent, probably a large extent, people are rationalizing the way they voted. But the way that people rationalize their actions is still interesting.
A large coefficient could mean that a group is held in high esteem (that people think it should be respected) or regarded as important in some sense. But from that point of view, the coefficients for white people and men are puzzling. Another factor could be whether respect from the candidate in question could be taken for granted. For example, there wasn't much doubt that Hillary Clinton respected women, and it didn't make much difference in support for her; there was a lot of doubt about whether Trump did, and it made a lot of difference in support for him. So the fact that perceived respect for men and white people didn't matter could be because most people thought they'd be all right regardless of which candidate won (this contradicts another popular story, about how Trump supporters were motivated by perceived threats against whiteness or masculinity).
The combination of these principles seems to make sense of the coefficients, with one exception: the difference in the effect of Trump and Clinton's perceived respect for supporters of their opponent. Clinton gained from being seen as respecting Trump voters; Trump didn't gain from being seen as respecting Clinton voters. This pattern suggests there's a bit of truth in the "liberal condescension" story--that on the average, people cared more about whether Clinton respected them than whether Trump did.
[Data from the Roper Center for Public Opinion Research]
Trump Clinton
White people 3.23 3.03
Men 3.21 2.77
Veterans 2.84 2.73
Women 2.19 3.16
Blue collar workers 2.64 2.66
Black people 2.31 2.84
Evangelical Christians 2.66 2.42
Hispanic people 2.16 2.85
Immigrants 2.00 2.93
Muslims 1.86 2.93
People who support [opponent] 1.91 1.91
The standard errors are about .03 or .04. The ratings aren't surprising--Trump is seen as having substantially less respect for women, black and Hispanic people, immigrants, and Muslims, and somewhat more respect for white people, men, veterans, and evangelical Christians. However, it's noteworthy that Trump and Clinton are rated almost exactly the same in respect for blue collar workers--this is one of many pieces of evidence that contradicts the popular story that working class voters turned to Trump because they thought that liberals were condescending to them. It's also notable that Clinton was seen as having pretty high respect across the board--her perceived respect for Evangelicals, which was lower than her perceived respect for any group except Trump supporters, was higher than Trump's perceived respect for six of the groups.
What difference did these perceptions make? I regressed intended vote on each candidate's perceived respect for the groups (one half of the sample was asked about women, men, whites, blacks, Hispanics, and veterans; the other about Muslims, evangelicals, immigrants, blue collar workers, and people who supported the other candidate). The logistic regression coefficients, with positive values meaning that more perceived respect for the group goes with more support for the candidate (standard errors are typically about .2 or .3, and standard errors of the differences about .3):
Trump Clinton
White people -0.31 -0.03
Men 0.12 -0.09
Veterans 0.66 1.14
Women 1.13 0.32
Blue collar workers 1.10 1.19
Black people 1.17 1.06
Evangelical Christians 0.34 0.91
Hispanic people 0.74 0.62
Immigrants 0.57 0.04
Muslims 1.53 0.72
People who support [opponent] -0.13 0.77
I don't think that perceptions of respect are necessarily causes of the way that people vote: to some extent, probably a large extent, people are rationalizing the way they voted. But the way that people rationalize their actions is still interesting.
A large coefficient could mean that a group is held in high esteem (that people think it should be respected) or regarded as important in some sense. But from that point of view, the coefficients for white people and men are puzzling. Another factor could be whether respect from the candidate in question could be taken for granted. For example, there wasn't much doubt that Hillary Clinton respected women, and it didn't make much difference in support for her; there was a lot of doubt about whether Trump did, and it made a lot of difference in support for him. So the fact that perceived respect for men and white people didn't matter could be because most people thought they'd be all right regardless of which candidate won (this contradicts another popular story, about how Trump supporters were motivated by perceived threats against whiteness or masculinity).
The combination of these principles seems to make sense of the coefficients, with one exception: the difference in the effect of Trump and Clinton's perceived respect for supporters of their opponent. Clinton gained from being seen as respecting Trump voters; Trump didn't gain from being seen as respecting Clinton voters. This pattern suggests there's a bit of truth in the "liberal condescension" story--that on the average, people cared more about whether Clinton respected them than whether Trump did.
[Data from the Roper Center for Public Opinion Research]
Saturday, August 26, 2017
What went wrong?
Two years ago, not many people thought that Donald Trump would get the Republican nomination. In late July, a McClatchy/Marist College polls asked Republicans "Do you think Donald Trump is a serious presidential candidate, or a distraction from the presidential primary process?" 44% said a serious candidate, and 51% said that he was a distraction. On August 13, 2015, I had a post that offered probabilities of getting the nomination: 40% for Jeb Bush, 20% for Marco Rubio, 15% for John Kasich, 12.5% for other declared candidates, and 12.5% for someone else. If I'd gone farther, I think I would have put Trump at or near the top of the others, with maybe 5%. I give myself some credit for not being impressed with the field--this was when people were still talking about the "deep bench." But no matter how you slice it, I thought Trump had little chance of winning. Sometimes unusual things happen--someone who had little chance of winning could make it because of a lot of unpredictable things. But looking at the campaign, I don't think that Trump got all that many lucky breaks, so I'm not going to try to defend my prediction that way. I think that a large part of the reason I didn't give him much chance was that I thought he wouldn't stay in very long--that the first time he encountered adversity he would quit, complaining that the rules were rigged against him. But why was I confident of that? I was certainly familiar with Donald Trump--I'd been hearing his name since the early 1980s. But I didn't really know much about him--I hadn't read any of his books, or biographies of him, or watched his media appearances. So my mistake was in taking general familiarity for real knowledge about him--I should have started by thinking about what would happen if he was serious about the race, and if I had I would have rated him higher.
The same post offered some ideas about the sources of his support at the time. I said that a large part of his appeal was negative--people distrusted politics and politicians, and he was an outsider. An alternative is that he made a positive connection to a large number of voters. Reporters who attended his rallies were often struck by the energy, and many people talked about an "enthusiasm gap" in favor of Trump during the general election campaign. A Pew survey in October 20-5, 2016 asked separate questions about whether Trump and Clinton would be: great, good, average, poor, or terrible. The results:
Trump Clinton
Great 9% 10%
Good 17% 28%
Average 15% 18%
Poor 12% 12%
Terrible 47% 31%
That's not much enthusiasm for Trump, but it includes both supporters and opponents. If we limit it to people who said they would support the candidate:
Trump Clinton
Great 21% 19%
Good 39% 54%
Average 30% 25 %
Poor 7% 2%
Terrible 2% 0%
At least in this respect, Clinton supporters were move favorable about their candidate than Trump supporters were about theirs. In fact, 10% of the people who said they would vote for Trump thought that he would be a poor or terrible president.
On a possibly related note, of the people who had the same expectations of Trump and Clinton (e. g., said both would be average), 75% said they would vote for Trump. I haven't investigated, but one possibility is that they were Republicans who figured that even if he wouldn't be especially good, Republicans in Congress would get their way if he were president. So I think my original analysis was correct on that point--Trump got the Republican nomination more because of his opponents' weakness than because of his strength. After he got the nomination, party loyalty kept him close enough to have a chance.
[Data from the Roper Center for Public Opinion Research]
Saturday, August 19, 2017
Don't blame the millennials
I have seen a number of articles challenging the "myth" that millennials are less racist than previous generations, and the rally in Charlottesville has inspired more of them. For example, in the Washington Post, Catherine Rampell writes:
"If there was one silver lining to President Trump’s election, it was supposed to be this: Those who voted for Trump because of, rather than despite, his demonization of Muslims and Hispanics; who fear a 'majority minority' America; and who wax nostalgic for the Jim Crow era were mostly old white people.
Which meant they and their abhorrent prejudices would soon pass on — and be replaced by generations of younger, more racially enlightened Americans.
The white nationalist rally this past weekend in Charlottesville clearly proves this to be a myth."
She points out that many of the participants in the rally, including the man who killed one counter-protester and injured about 20 more by driving his car into a crowd, were young. But young people, especially young men, are more likely to engage in all kinds of violence, and high-risk behavior more generally. Also, the numbers who participated in the white nationalist rally were small: according to Wikipedia about 100 on Friday night and 500 on Saturday. So the only myth that the rally disproves is a myth that no one believes: that absolutely no young people hold racist views.
But Rampell also offers some more serious evidence: a story called "white millennials are just about as racist as their parents," which is based on analysis of General Social Survey data from 2010-14. It considers five issues: ratings of how intelligent and hardworking blacks and whites are (each based on one question about whites and one about blacks), how you would feel if a relative intended to marry a black person, how you would feel about living in a neighborhood that was 50% black, and that a reason for racial differences in jobs, income, and housing is that "most blacks just don't have the motivation or will power to pull themselves up out of poverty." It reports that "White millennials (using a definition of being born after 1980) express the least prejudice on 4 out of 5 measures in the survey, but only by a matter of 1 to 3 percentage points, not a meaningful difference."
(By "white" they meant non-Hispanic white).
I redid the analysis, making the following changes:
1. Including three more variables, whether there should be a law against marriages between blacks and whites, whether racial differences were because blacks had less inborn ability, and whether blacks shouldn't push where they aren't wanted.
2. Adding data from 2016, and 2000, 2002, 2004, 2006, and 2008. The 2016 data wasn't available when the article was written. As far as 2000-2008, some millennials were old enough to be included in the survey in all of the years, and generational differences tend to be enduring.
3. Using averages for variables that were measured with more than two categories (like ratings of intelligent and hard working." I'd say that a person who rates blacks at 3 and whites at 4 is different from a person who rates blacks at 1 and whites at 7.
4. The story just included the "silent generation" (born 1928-45), "baby boomers" (1946-64), "generation X" (1965-1980) and millennials. I also included people born through 1927.
The percent giving the "racist" response for the three yes/no items:
Marriage law Inborn Willpower
Oldest 27% 25% 69%
Silent 17% 15% 59%
Boomers 8% 7% 45%
X 6% 6% 44%
Millennials 3% 5% 38%
The means for the other items (higher numbers mean more "racist"):
Don't push marry intelligent lazy half
Oldest 2.85 3.77 1.01 1.30 3.32
Silent 2.50 3.45 .60 1.01 3.12
Boomers 2.11 3.03 .35 .65 2.97
X 1.97 2.77 .32 .53 2.90
Millennials 1.85 2.63 .23 .36 2.87
Millennials are least prejudiced on all eight of the questions: in fact, each generation is less prejudiced than all previous generations on all eight of the questions. As far as whether the difference is meaningful, there's no absolute standard, but one way to judge it is to do a principal components analysis, which gives a score for each generation:

According to this, the difference between millennials and boomers is about half as large as the difference between boomers and the "silent generation." Although the rate of change has slowed down, racial prejudice is still declining from one generation to the next.
Subscribe to:
Posts (Atom)