The other day, Paul Krugman proposed that Liz Truss failed because her program appealed to people who are to the right on economics and to the left on social issues: "a barren quadrant where few voters may be found." He refers to an analysis by Lee Drutman, which classified people into four groups: 45% to the left on both, 23% to the right on both, 29% to the left on economics and to the right on social issues, and only 4% to the right on economics and to the left on social issues. Clearly the exact numbers will depend on the questions you use to measure the dimensions, and in an earlier post I objected to some of his choices, but didn't propose an alternative. I'll start with a simple one in which the economic dimension is measured by a GSS question:
"Some people think that the government in Washington ought to reduce the income differences between the rich and the poor, perhaps by raising the taxes of wealthy families or by giving income assistance to the poor. Others think that the government should not concern itself with reducing this income difference between the rich and the poor. Here is a card with a scale from 1 to 7. Think of a score of 1 as meaning that the government ought to reduce the income differences between rich and poor, and a score of 7 meaning that the government should not concern itself with reducing income differences. What score between 1 and 7 comes closest to the way you feel?"
That's a pretty good summary of the basic difference between left and right on economic issues. To make the tables simpler, I'll divide it into left (1-3), middle (4), and right (5-7). There's no parallel question for social issues (and it's hard to imagine one), so I'll use a question on an important and long-standing issue: whether a woman should be able to get a legal abortion if "she wants it for any reason." That's a yes/no question (I'll omit the small number of don't knows. Over the whole period for which there is data (1978-2021), there is no association between opinions on these questions: 43% of economic liberals, 40% of economic moderates, and 42% of economic conservatives are in favor of legal abortion. But in recent years, a positive association has appeared:

That means that there has been a change in the distribution among groups, even though overall opinions on both redistribution and abortion have been pretty stable
1978-2000 2002-2008 2010-2021
LL 18% 21% 27%
LR 29% 25% 23%
RL 15% 14% 13%
RR 19% 21% 21%
The percentages don't add to 100--the rest are people who were exactly in the middle (4) on redistribution. Although the LR and RL groups have declined, they still make up 36%, compared to 48% for "consistent" liberals and conservatives.
A few years ago, I had a post noting that there were a lot of people with RL or LR positions, but few politicians trying to represent them. Krugman offers this diagram:
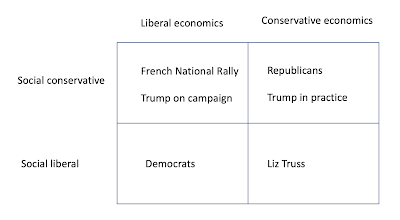
In his analysis, the conservative economics/social liberal combination is rare, so there are only three substantial groups among the public, and they all have representation. However, as I've noted several times, there's no evidence that ordinary voters saw Trump as liberal on economic issues. The characterization of the National Rally is also questionable. So the puzzle is still there.
PS: Although I wasn't following closely, I don't think that Truss's problem was that her policies were inherently unpopular--what hurt her was the reaction of the financial markets. Also, it's a parliamentary system, so a party can easily drop a leader when they become a liability, and it sounds like she started with relatively weak support among Conservative MPs.
Truss was also an enthusiastic culture-warrior, or at least willing to pretend, and appointed plenty of them to important posts.
ReplyDelete