Thursday, December 29, 2022

Out of the file drawer, part 2

 My last post was about data on perceptions of moral conditions from 1949 to 2022.  There is a clear decline over the period, but I wanted to go beyond that and consider questions like whether the decline was steady or concentrated in particular periods and whether it's something that continues today.  A simple starting point is a regression model with time and time squared (plus dummy variables for the different question) as predictors.  In this model, the squared term is statistically significant (t=2.3)--I tried a couple of higher order terms and they were not.  Another model has two linear terms for different periods--the best fit comes with the periods 1949-68 and 1969-2022.  Predicted values for the two model are shown in the figure:


Both models (which fit about equally well) indicate that the decline was larger in the early years, but the predictions diverge in recent years--according to the quadratic model, the low point came around 2007, and assessments have becoming more favorable since then; according to the spline model, the decline is continuing.  With both models, there is some correlation in the residuals--periods when the values are consistently above or below the predicted values.  So overall, I don't think it's possible to be sure about whether the decline has stopped, but it's clearly slowed down.

This connects to a point that I've made before--that views about people and society in general became more negative in the 1960s and 1970s, but haven't changed much in the last few decades.  So accounts which attribute the recent rise in political polarization to discontent about people or society or economic conditions don't fit the timing.  In principle, you could argue that there was some kind of delayed response--that discontent didn't start affecting political views until time had passed.  However, another possibility, which I find more convincing, is that polarization in the public is a reaction to political developments--that is, it started with elites.

[Data from the Roper Center for Public Opinion Research]    


Wednesday, December 21, 2022

Out of the file drawer, part 1

 Sometime around 2000, I searched for questions about the general moral condition of the country.  I wanted to trace changes in the assessment, so I was only interested in questions that had been asked at least twice.  I found seven questions with a total of thirty occasions, ranging from 1949 to 1999.  I didn't try to publish the research, although I talked about it at a conference or two, but I thought about it from time to time and finally came back to it, thinking that at least I'd have more data to work with.  To my disappointment, I found only a five more occasions, and none after 2005.  The questions and results are listed below--I give the results in the form of favorable vs. unfavorable assessments.  

1.  On the whole, would you say that you are satisfied or dissatisfied with the honesty and standards of behavior of people in the country today?

Positive    Negative          Year       

34%         59%               1963

27%         66%               1965

26%         66%               1966

22%         72%               1973

33%         63%               1986

23%         71%               1987

24%         73%               1991

20%         78%               1992

27%         68%               1992

32%         68%               1998

21%         74%               1999

2.  Do you think people in general today lead as good lives--honest and moral--as they used to?

47%         46%               1952                         

39%         52%               1965                         

30%         66%               1976

26%         71%               1998

21%         73%               2002

21%         74%               2005

3.  Do you think that young people today have as strong a sense of right and wrong as they did, say, fifty years ago?

57%         34%               1952                   

41%         46%               1965                         

20%         78%               1998                         

15%         82%               1999                         

19%         76%               2002

18%         79%               2005

4.  Which of the following statements comes closest to expressing how you feel about the state of morals in this country at the present time?  (Pretty bad vs. pretty good).

37%         55%               1964                    

19%         77%               1996                    

32%         63%               2004

5.  Do you believe that life today is getting better or worse in terms of morals?

20%         52%               1949             

 8%         78%               1968                               

17%         70%               1985

17%         69%               1986

6. Do you believe that life today is getting better or worse in terms of honesty?

24%         36%               1960

13%         61%               1968

7.  Do you personally agree or disagree with those who feel that there is something morally wrong with the country at this time?

35%         61%               1976

25%         71%               1992

19%         77%               1993                    

Then I discovered the good news--almost every year since 2002, Gallup has asked "Right now, do you think the state of moral values in the country as a whole is getting better or getting worse?"  Results can be found at: https://news.gallup.com/poll/393659/record-high-americans-rate-moral-values-poor.aspx

So now I can put it all together and get a picture of changes since 1949:


There's a pretty clear downward trend, but to go beyond that observation, you have to consider the fact that the questions aren't identical, and even if you trust my judgment that they are similar, they might get somewhat different responses.  The simplest way to adjust for this is to calculate the mean for the question and subtract it from the score at each time.  The results:


This way, it doesn't seem like steady decline.  I'd describe it as a decline in  the 1960s, followed by some recovery and then stability into the 1980s, then a decline into the 1990s, and then rough stability, or maybe even some increase.  I've experimented with fitting some models, but haven't found anything that I have much confidence in yet, so I'll save that for a future post.

[Data from the Roper Center for Public Opinion Research]


Friday, December 9, 2022

Substitute

 A couple of months ago, I had a post which discussed research and reporting on the link between mental illness and mass shootings.  Andrew Gelman blogged about it the other day, and it has become my most viewed post (by a large margin) so I thought I should follow up on it.   However, after I started a post on it I couldn't think of anything interesting to say.  I'll come back to the issue, but meanwhile here's a post on a totally unrelated subject: 

Georgia just finished its runoff election for Senator.  It's one of only two states that have runoffs in general elections (the other is Louisiana)--everywhere else, the winner is the candidate who gets the most votes on election day.  The Washington Post had a story on the origins of the system--it involved a state legislator named Denmark Groover who lost his seat in a three-way race in 1958, made it back to the legislature, and dedicated himself to getting a runoff added.  He also was a hard-line segregationist who helped to devise measures to limit black voting power after court rulings and legislation made it more difficult to simply prevent black people from voting.  So the runoff was seen as a measure to protect white supremacy, and later in life Groover said that was how it was intended.  

The history was interesting, but what surprised me was that the controversy continues.  The story concludes by saying "voting rights groups in Georgia overwhelmingly support abolishing runoffs" and quoting the director of a voting rights group as saying "it is a relic of Jim Crow, it is suppressive, inefficient and is also fiscally irresponsible.  It needs to just go away."  The reporter also seems to have been persuaded--he quotes several other critics and no defenders.

Regardless of the origins of the runoff in Georgia, the idea that it should take a majority vote to win seems to fit with the popular idea of democracy, so there's a good case for the runoff in principle (Brazil and France both have runoffs in their presidential elections).  So I was interested in looking at public opinion on the issue.  I found only one question, from 1984:  "In some states, if no candidate wins more than half of the votes in a primary election, a runoff primary is held between the top two candidates. Do you think this is a good system, a bad system, or don't you have an opinion on this?"  Although that asks specifically about primary elections, it involves the same general issue, and applies more widely:  quite a few Southern states had (and I think still have) runoff elections in primaries. 

40% said that it was a good system, only 11% said it was bad, and 45% said they didn't have an opinion (the rest said they didn't know--I eliminated them from the rest of the analysis, although you could make a case for combining them with "don't have an opinion").  

The breakdown by race:

                      Good      Bad          No opinion
Black              43%        11%           46%
Non-black      43%         13%          44%

No discernible difference.

Region:

East                 40%           15%           45%
Midwest          38%           10%           52%
South               48%           14%           38%
West                 46%             8%           46%

Maybe some differences, but it's hard to be sure, except that Southerners were less likely to have no opinion.

Education reduced the share of "no opinion" but didn't have much impact on the ratio of favorable to unfavorable opinions.  There were no visible differences by party or ideology.  Women were a bit more likely to have no opinion, and to favor a runoff if they had an opinion.  The strongest demographic factor was age--young people were more likely to favor a runoff.  

18-29               49%               8%            42%
30-44               47%             13%            41%
45-64               43%             13%            44%
65+                  25%             16%            58%

I also considered region by race:  Southern whites were more favorable and less likely to have no opinion, but there were no clear regional differences among blacks (the survey oversampled blacks, so the numbers were reasonably large).

While doing this post, I discovered that Jesse Jackson had called for an end to the runoff system, and was even suggesting that he might make it a condition of supporting the Democratic nominee (the survey was taken in June, so the issue was in the news at the time).  That makes the absence of a racial difference particularly interesting.  My guess is that intuitions about fairness dominated everything else, among voters who had an opinion.  Whether a runoff actually worked* against the interests of black voters is a complex issue, so even voters in states with runoffs wouldn't easily be able to judge from experience.  And unlike the Electoral College, the runoff didn't have a long history, so attachment to tradition wasn't a factor.

*I say "worked" because the effects may have changed since 1984, given changes in the racial composition of the parties and increased willingness of white voters to support black candidates.  


[Data from the Roper Center for Public Opinion Research]

Tuesday, November 29, 2022

Representation

 A few weeks ago, I had a post on opinions about whether the Supreme Court should consider public opinion when making decisions.  There was a strong relationship to education:  more educated people are more likely to say that it should just consider the legal issues, while less educated people are more likely to say that it should consider what the public thinks.  There's a similar question that applies to elected officials--should they do what their constituents want, or should they use their judgment about what is in the best interests of their constituents?  

Although this is a classic issue in political theory, I could find only one relevant survey question, from 1993:  "When your representative in Congress votes on an issue, which should be more important:  the way that voters in your district feel about the issue, or the Representative's own principles and judgment about what is best for the country?"  70% said the way that voters feel, and 23% said the representative's principles and judgement (3% volunteered that it should be both and 4% said they didn't know).  In contrast to opinions about how the Court should decide, opinions on this issue had little or no connection to education (if there's a relationship, it's curvilinear, with people at middle levels of education most likely to favor going with the voters). Opinions had some connection to political views, with liberals and people who had voted for Clinton more likely to favor representatives using their own judgment--but even they had solid majorities in favor of following the voters.  

While searching for questions, I found one from 1992 on a related issue:  how representatives should vote on choosing a president if there was no Electoral College majority (in the summer of 1992, Ross Perot was running about even with Bush and Clinton, so this seemed like a real possibility).  The options were voting for the candidate who got the most votes across the nation, the state, or the congressional district, or voting for the one who they thought would make the best president.  Opinions on this question were related to education:  people with more education are more likely to say they should go with the district and less likely to say they should vote for the candidate who they think would make the best president (the other two options are about equally popular among all educational levels).  It's a strong relationship:  support for following the district goes from about 8% among people with no college to 30% among college graduates; support for choosing the candidate who they think would make the best president goes from about 45% among people with no college to 20% among college graduates.

So when thinking about the Supreme Court, more educated people are less likely to favor the "populist" position; when thinking about elected representatives, that's not the case.  Why?  The Supreme Court justices have an area of specialized expertise--interpreting the law.  Elected representatives don't have any definite area of expertise--if they have any advantage over the public, it's general judgment and experience.  It seems plausible that education increases respect for expertise, but not for claims of superior judgment and experience (if anything, it may increase confidence in your own judgment, so you're less likely to defer to others).   The difference in the relation of education to opinions about votes on the issues and votes on the president is puzzling, but it could be that educated people have a better understanding of how the process would probably work--in practice, voting for the candidate they think best would mean voting for the candidate of your party.  Given a choice between voting by party and voting by the wishes of their district, the second seems more fair.  But overall, I think these results support my suggestion that distrust in politics is distinct from distrust in experts.

[Data from the Roper Center for Public Opinion Research]

Sunday, November 20, 2022

Who has changed?

 People with more education used to be more likely to vote Republican than people with less education.  Things have now reversed, so more educated people are less likely to vote Republican.  Is that because more educated people have moved towards the Democrats, or less educated people have moved towards the Republicans, or some of both?  The figure shows average party identification in the General Social Survey, 1972-2018 (I limit it to whites, because the black vote is overwhelmingly Democratic and there's never been a clear educational divide).  

Republicans are 3, Independents 2, and Democrats are 1, so an average of 2.0 means equal numbers of Democrats and Republicans.  Between 1972 and 1990, both college graduates and people without college degrees moved towards the Republicans, at about the same rate.  Since the 1990s, the groups have diverged:  college graduates have moved towards the Democrats, while people without college degrees have stayed about the same.

So the reversal of the "education gap" has been mostly the result of changes among more educated people.  Of course, there may also be currents of opinion that affect people of all educational levels, so it's possible that the changes among college graduates reflect the general current of opinion, while the changes among less educated people reflect the general current plus some offsetting factor.  

However, the practical implications of the two interpretations aren't too different.  Either Republicans should be concerned about the trend among educated people, or they should be concerned about the general current.  Either way, it means they should be concerned about stopping their losses among educated people, whether that's by specifically appealing to educated people or by appealing to people in general.  But that doesn't seem to be the case--as I've mentioned before, they seem to be fascinated by the idea that they can win by becoming a "working-class party" (see this piece by Josh Hawley for an example), and uninterested in winning back educated voters.    


Sunday, November 13, 2022

Law and public opinion, part 2

 It took a while, but I am returning to a question I wrote about in a previous post:  ""When the Supreme Court decides an important constitutional case, should it only consider the legal issues, or should it also consider what the majority of the public thinks about that subject?"  It was asked in 1987, 2005, 2013 (twice), and 2015.  In my previous post, I noted that there was a strong relationship to education:  more educated people were more likely to say it should only consider the legal issues.  I also noted that support for the "legal issues" option seemed to be increasing.  Now I want to connect those, by considering the relationship between education and opinions at three different times, 1987, 2005, and 2015.  On the average, educational levels have been rising as older generations are replaced by more educated younger ones, so it's reasonable to ask if the increase in support for "only consider the legal" issues just reflects rising levels of education--in fact, it's possible that support has been declining within educational categories.  There's also a question of whether the educational differences have remained constant.  The following table gives opinions in the form x-y, where x is the percent saying "only legal issues" and y is the percent saying consider what the majority thinks--they add to less than 100 because some people said that it should be some of both:

                                             1987                2005              2015

No HS diploma                   15-81                23-72             29-69
HS only                               26-70                40-57             43-54
Some college                       39-59                57-39             60-37
College grad                        62-35                66-29             74-24

There was a strong relationship to education at all three times, but support for the "only legal issues" option rose in all educational groups.  As I mentioned before, the 1987 figures may have been affected by the context--the survey was taken during the nomination of Robert Bork, who seemed to delight in taking unpopular positions--but there was also an increase from 2005 to 2015 in all educational groups.  Also, there was little or no relationship between opinions and partisanship in 1987--to the extent that support for "only legal issues" was a reaction against Bork, you'd expect it to be more popular among Democrats.   (There was also no clear relationship to partisanship in 2005;  Republicans were a little more likely to favor considering the majority in 2015).  

Many accounts of recent politics hold that there's been a shift towards "populism" in a broad sense--a belief that the public should decide directly rather than leaving it to experts and authorities.  There's certainly some evidence supporting that, particularly the decline in confidence for most institutions.  

 There have been a few questions about the power of the Supreme Court over the years.  In 1957, Gallup asked "Some people say that the Supreme Court has too much power these days.  Do you agree or disagree with this?"  Then in 1982 a CBS News/NY Times survey asked " Some people think the Supreme Court has taken too much power that should belong to the President and Congress. Other people think the Supreme Court has been carrying out its proper responsibilities under our system of government. Do you think the Supreme Court has taken too much power, or is it carrying out its proper responsibilities, or don't you know enough about this to have an opinion?"  Finally, starting in 2015, the Pew Research Center has asked "Do you think the US Supreme Court has too much power, too little power, or the right amount of power?"  They're not identical, but seem similar enough that a comparison is reasonable.  The results:

                Too much        Not too much

1957                26%                    53%
1982                17%                    39%
2015                36%                    61%
2019                21%                    74%
2020                33%                    65%
2022 (Jan)        41%                    58%
2022 (Aug)       45%                    53%

Belief that it had too much power has increased in the last few years (interestingly, it was almost as high in January 2022 as in August), but didn't show much trend before then.  So, as I've suggested before, the decline in institutional confidence might involve a distrust of politics rather than a distrust in "experts". 

[Data from the Roper Center for Public Opinion Research]

Friday, November 11, 2022

How good was it?

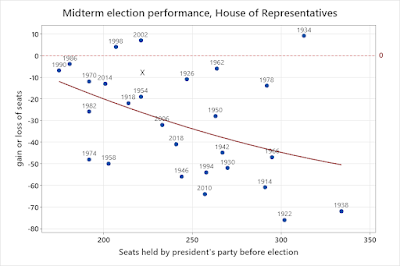
The President's party almost always loses seats in midterm elections.  But is it normal to lose a lot of seats, or do people just remember those cases better than those in which the president's party loses a few seats?  That is, did the Democrats have an outstanding performance this year, or just a pretty good one?  I looked at all midterm elections since the House of Representatives went to 435 members (1914 was the first).  The mean loss of seats was 31; the median was 28.  It looks like the Democrats will lose 5-10 this time, which would be the 6th or 7th best out of 28.  But we should also consider the starting point--when you come in with a lot of seats, it's hard to gain and easy to lose.  The figure plots the change against the number of seats the party had in the previous House:


"X" is the approximate location of the 2022 election.  Whether or not you consider the number of seats coming in doesn't make much difference for 2022--either way, it's a good but not exceptional performance.  But it makes a significant difference in some cases:  the big losses for the Democrats in 1966 were a normal performance and the small losses in 1978 were an unusually good one.  I'm not old enough to remember the 1966 election, but I do remember 1978 (it was the first election in which I was eligible to vote) and I had thought of it as a very bad year for the Democrats.  I think that's partly because the late 1970s were a conservative period in some respects (e. g., Proposition 13 passed in 1978), and partly because the Carter administration ended in failure, so there's a tendency to remember it as an unbroken series of failures.  Similarly, I had remembered 2006 as a bad year for the Republicans, but their losses were only a little worse than you could expect.  Like Carter, Bush ended badly, and that colors the memory of everything that happened in his presidency.  And 1934 is a much more impressive accomplishment than 2002 or 1998, although all three involved similar gains for the incumbent party.