The figures presented in my last post (taken from an article in The Lancet) indicated that killings by police increased between the 2000s and the 2010s, with the biggest increase occurring for non-Hispanic whites. This post will take a closer look at that change. There are several data sources--the National Vital Statistics System, based on death certificates, and two unofficial counts based on publicly available reports (mostly news stories)--Mapping Police Violence and Fatal Encounters.* The counts from these sources:

Fatal Encounters started in 2000, but the coverage in the early years was less complete. The Lancet article that I mentioned last time concludes that it has more or less complete coverage starting in 2005, so I just show those years in the figure. All three series show upward trends, but the rate of increase differs. Mapping Police Violence clearly doesn't increase as rapidly as the others. The difference between Vital Statistics and Fatal Encounters is less obvious, but Vital Statistics shows a somewhat larger increase (between 2005 and 2021, deaths increased by 54% in Fatal Encounters and 85% in Vital Statistics). I don't know why there might be a difference between FE and MPV, but my guess is that the recording became more complete in NVSS--that is, death certificates became more likely to note police involvement rather than just the physical cause of death--because the issue was getting more attention. However, the fact that the MPV and FE counts also increased is evidence that there was a real change--it wasn't just more complete reporting.
But there is one more source: Justin Nix has compiled reports from about 400 police departments covering various periods of time ranging from 8 to 52 years. I fit a model that included effects for department and year. The estimates by year for the 2000-2020 period:
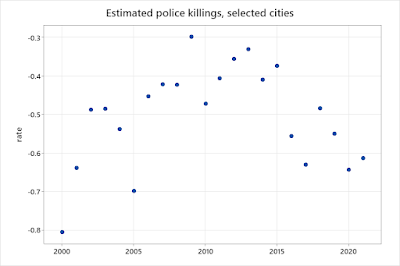
The pattern is completely different--an increase until about 2010, and then a decline. How could you account for the difference? Nix's data include only around 3% of all police departments in the country, but most of the biggest cities: e. g., New York, Chicago, Philadelphia, LA, and Houston. So maybe smaller places are behind the increase?
The NVSS data can be broken down by a classification of urbanism:

The increase was distinctly larger in "medium metro," "micropolitan," and "small metro" (definitions are here). Back when this issue started to get attention, I recall reading that police departments had acquired a lot of new equipment as part of the "war on terror" or surplus from the Iraq war. It seems likely that this would have had more impact on smaller police departments, might adopt more aggressive tactics as a result of having new capacity. The fact that the increase was larger in smaller cities might also help to explain why it was larger among whites than among blacks--the white population is relatively larger in small and medium metro areas.
In one of my previous posts on this subject, I mentioned the idea that state and local governments are "laboratories of democracy." That suggests that they will compare experiences and adopt policies that work better. But differences in rates and trends haven't received much attention in the debate on police killings. On the progressive side, you get empty generalities like "the USA must replace militarised policing with evidenced-based support for communities, prioritise the safety of the public, and value Black lives" (the last sentence of the Lancet article); on the right, the issue gets dismissed as part of a "war on cops."
*The Washington Post compilation just involves deaths by shooting. There's also a project called The Counted, but that only covers 2015 and 2016, so it's not useful for looking at trends.
It's great that some organizations are keeping data, but it would be most interesting to know what about their methods leads to such dramatic discrepancies. Beyond that: 1) the military equipment idea strikes me as mostly political and not actually relevant; but is there any evidence to support it? 2) the classification of urban types is subjective and fraught with other problems - that is, today's rural areas are tomorrows suburbs, and how fast that happens varies wildly around the country.
ReplyDeleteOh: 3) is anyone tracking attacks on police officers or situations where they are confronted with weapons? Again, like with the data on how people perceive immigrants, which needs to be viewed in context with levels of immigration, it strikes me as half the picture to look only at police shootings.
Shortly after the Michael Brown incident (2014) a video emerged of an officer shooting an suspect in a nearby area. The suspect was a kid, maybe 16-20. IIRC, he was about to be patted down when he attempted to pull a gun on the officer. The officer drew his weapon and shot the poor stupid kid in an instant. For me that video spoke very powerfully about the ignorance of the typical suspect and the value of police training. A rise in police shootings could result from changes or improvement in their training.