Thursday, September 22, 2022

Or do they?

 Thomas Edsall recently had a piece that began by asking "Why do millions of Americans on both the right and the left ignore their own economic self-interest when they choose which political party to support?"  His answer was that "Partisan prioritization of cultural and racial issues has, to a notable extent, superseded the economic conflicts that once characterized the nation’s politics..."  This led to a change in the social bases of the parties: "millions of working- and middle-class whites have shifted their focus away from the goal of income redistribution ...to support the Republican preference for traditional, even reactionary, sociocultural values. At the same time, college-educated white voters have come to support tax and spending initiatives that subordinate their own financial self-interest in favor of redistribution and liberal social values."  He went on to say that this shift was the result of economic growth:  as people become more affluent, they can afford the "luxury" of voting on the basis of values rather than self-interest.  

As Edsall noted, this general analysis has been around for a long time.  In 1960, Seymour Martin Lipset said that the working class tended to support parties of the left because of "simple economic self-interest.   The leftist parties represent themselves as instruments of social change in the direction of equality; the lower-income groups support them in order to become economically better off, while the higher-income groups oppose them in order to maintain their economic advantages."  But Lipset also observed that working-class people tended to be more conservative on what we would now call "social issues" like civil liberties and ethnic tolerance.  So the relationship between class and party support would shift depending on the relative importance of economic and social issues.  The overall support for left and right would also change:  the left had an advantage on economic issues because there are more relatively poor people than right ones; the right had an advantage on social issues because it was associated with patriotism and "traditional values."  In the 1970s, Ronald Inglehart added the idea that as their standard of living increased, people would give lower priority to material interests and higher priority to values. Putting those together, you get a model of political change that seems to explain a number of important developments--the gradual shift in the class bases of left and right parties, the rise of a new "woke" left and "populist" right, and the decline of the traditional class-based left.  Edsall suggests that it also helps to explain the growth of inequality (less pressure from the working class to do something about it) and the rise of political polarization--"the displacement of economically based partisan conflict by racial and cultural issue-based conflict has escalated political and social animosity."

I've discussed aspects of this account in some of my academic work and some previous posts.  In this post, I will discuss the its general logic.  Although it certainly contains an element of truth, it goes wrong in treating four things as roughly equivalent:  self-interest, redistribution, economic issues, and class (income) politics.   First, there is a straightforward connection between redistribution and self-interest in the short term, but in the long term, self-interest also involves economic growth, and redistribution may affect growth. The poor person who opposes redistribution and the rich person who favors it can both make a case that they are following their self-interest.  Moreover, those cases don't depend on sophisticated economic analysis--you can put either one in common-sense terms.  Also, the long term doesn't have to be that long--a few years of recession versus strong economic growth can make a big difference.    Second, views of economic issues aren't just a matter of self-interest--they also involve values.  Of course, there is some tendency for ideas of fairness to align with self-interest, but they do matter, both in support for redistribution ("we can't just let people starve") and opposition ("I don't want a handout").  Third, redistribution can occur along many different lines, not just rich to poor.   Redistribution from rich to poor is the most efficient, in the sense that it raises the most revenue while antagonizing the smallest number of people, and that will give it some appeal to vote-seeking politicians.  But other kinds of redistribution are more likely to coincide with existing identities (e. g., ethnicity) or beliefs about fairness (e. g., helping veterans or old people).  So voting in favor of redistribution to yourself may not mean voting on class lines.  

I agree that increasing affluence means that self-interested redistribution becomes less important.  But that doesn't mean that economic issues or the general issue of inequality become less important, and doesn't directly imply anything about class alignments.  What it does mean is that the old style of patronage politics (get something for my constituents) declines at the expense of ideological politics (act on the basis of some principle or theory).  

Lipset's idea that the left does better when economic issues are primary remains popular today.  Moderate Democrats say that the party would do better if it stepped back the "culture wars" and emphasized "kitchen table" issues.  Progressives say that the party would benefit from taking a stand for the working class against the rich and corporations.  I don't think that this is true either--some parts of the traditional program of the left are popular (e. g., minimum wage laws), some are unpopular (e. g. aid to working-age people who aren't working), and some are mixed (e. g., support for unions).  So I don't think that a focus on economics has clear advantages or disadvantages for either side.  

Saturday, September 17, 2022

I don't care if I never get back, part 2

In my last post, I discussed a question about whether you would like to work from home after the coronavirus pandemic was over.  Blacks were more interested in working from home and more educated people were less interested.   The survey also contained some questions about how different aspects of your job had changed since the beginning of the pandemic, so I compared racial and educational groups on these.  An alternative approach would be to look for group differences in the difference between people who reported working from home more than they had before the pandemic vs. those reporting working from home the same (or less, in few cases).  I looked and didn't see much of anything, but given the sample size, there's very little power to detect interactions, especially for race.  However, I think that the simple comparison is meaningful because even people who were not currently working from home had experienced it and in most cases were still affected by it because of having co-workers who were working from home.  That is, the great majority of people in jobs where it was possible to work from home were experiencing a workplace in which people weren't all in the same place at the same time.

 All of the questions had a more/less/the same format, so I summarized them as percent more minus percent less.  

                                       non-black            black

Flexibility in hours             +28                        +18
Job security                          -11                       -5
Balance work/family             -1                        -13
*Connected co-workers        -45                       -22
Opportunities to advance    -16                        -12
Know what's expected         -15                       -9
Productive                             +0                         +3
More hours                          +14                        +16

Satisfied with job                  -6                          +2

The biggest difference (and the only one that is statistically significant) is in feeling connected to your co-workers.  Both blacks and non-blacks say that they are less connected, but the drop among blacks is only about half as large.  One possible explanation is that they felt less connected before the pandemic, so they had less to lose.  But more blacks reported an increase in feeling connected (16% compared to 8%).   It seems likely that remote work led to an increase in the importance of formal relative to informal communications.  That could mean that people who hadn't been near the center of things now felt like they were being consulted more or hearing sooner than they had been.  Blacks also did relatively better in knowing what your supervisor expected, opportunities to advance, and feeling productive, although none of the differences were statistically significant.  So these differences give some support to the account in the New York Times story that I criticized last time--the idea was that remote work meant that blacks could focus on doing the job rather than on trying to break into the "old boys' club."

                                        high school            some college     BA+

*Flexibility in hours             +8                        +18                     +30
*Job security                          -1                       -2                      -15
Balance work/family             -36                       -25                  -50
*Connected co-workers        -36                      -25                   -50
Opportunities to advance    -11                        -14                   -17
*Know what's expected         -3                       -10                    -19
Productive                             +3                         +4                 -1
*More hours                          +4                        +8                   +19

Satisfied with job                  -9                         -0                    -6

For education, there are several statistically significant differences:  more education workers report more increase in flexibility, but more drop in connectedness, knowing what's expected, and job security.  There's little or no difference in reported productivity, but more educated workers report more increase in hours worked.  I would say that the differences in connectedness and knowing what's expected are because interaction at work isn't just a matter of socializing or team-building, as the Times articles suggest, but also sometimes involve exchanging complex information, which is harder to do effectively in remote work.  Exchanging complex information is likely to be a bigger part of the jobs done by more educated workers, which accounts for the differences.  The combination of increased flexibility and increased hours also seems likely to be due to a difference in the kind of jobs:  more educated workers are more likely to have open-ended jobs.  It's also interesting that the relative increase in work hours is almost exactly balanced by a relative decline in job security--if workers are putting in more hours, employers may think they don't need as many.  

Common sense suggests that remote work will have different effects for different people, depending on personality, type of work, family situation, and lots of other things.  Moreover, it's not hard to think of ways in which it could enhance workers' power against employers and other ways in which it could reduce it.  So I'm not sure why the Times has become so attached to an interpretation in which remote work is an unambiguous good.  (Since I wrote my first post, it ran another story about the alleged benefits of remote work, this one saying that people were more productive outside the office).

[Data from the Roper Center for Public Opinion Research] 

Friday, September 9, 2022

I don't care if I never get back

Most claims of media bias involve partisan politics or left/right issues.  However, with those everyone is aware that there are differences of opinion and there are people and organizations who are recognized as representatives of major tendencies.  This puts some limits on bias--a journalist will try to have some balance between Democrats and Republicans, or experts from right-leaning and left-leaning think tanks.  With issues that don't fall into classic partisan or ideological terms, there won't be the same tendency to seek balance between different points of view, or even to realize that there are different points of view.   So bias may be more likely to occur on issues that aren't closely linked to traditional political divisions.

These thoughts are inspired by the coverage of remote vs. in-person work in the New York Times.  The prevailing tone is that remote work is obviously better.    Peter Coy says that "bosses are dragging white-collar workers back to the office despite evidence that they’re happier and often more productive when working from home," without linking to any evidence.   This  piece by Emma Goldberg cites a survey sponsored by "Future Forum, a research group backed by Slack," and then quotes a vice president of "Future Forum, Slack's research consortium."*  It offers several accounts of people who strongly favor remote work; it only briefly mentions that there are people who don't, and suggests that their reasons don't deserve to be taken very seriously:  "some people wrote to The Times to mourn their bonding conversations with teammates over Dungeons & Dragons, Nintendo and Marvel."

If they aren't going to look for data from established survey organizations that don't have an obvious financial stake in the issue, I'll have to do it myself.   Pew surveys in October 2020 and January 2022 asked "would you say that, for the most part, the responsibilities of your job can be done from home, or cannot be done from home?"  For those who said that they could (38% in 2020 and 39% in 2021) they asked "Looking ahead to when the coronavirus outbreak is over, if you had a choice, would you want to work from home all of the time, most of the time, some of the time, rarely, or never?"  The results:

                All      Most    Some  Rarely   Never

2020         27%    27%      33%      8%       3%
2022         35%    25%      28%      6%      3%


The 2020 survey also asked questions about how much people worked at home before the coronavirus outbreak and how much they worked at home now--about 70% were working at home more than they had been before--and about how some conditions at work had changed since the beginning of the outbreak.  By comparing the people who were working at home more than they had been to those who were not, we can get a sense of how remote work affected specific aspects of work.  I'll summarize the results by the difference between positive and negative responses.  For example, 21% of those who were working at home more said that they were more satisfied with their job than they had been and 23% were less satisfied (55% said no change), for a balance of -2.

                                    WFH more         WFH same/less

Satisfied with job                  -2                        -11
Flexibility in hours             +37                         +2
Job security                          -8                         -11
Balance work/family            +4                        -16
Connected co-workers        -53                        -15
Opportunities to advance    -17                        -12
Know what supervisor        -16                          -9
                  expects 
Productive                             +3                         -5
More hours                          +19                        +5

Some of the differences are as expected--people who were working at home more had a gain in flexibility of work hours and work/family balance.  They reported a big drop in feeling connected to their co-workers, which isn't surprising, but is sometimes disputed by supporters of remote work.   There are also some that are less predictable.  One is that people who are working from home report working more hours than before.  Another is that they have a larger decline in knowing what the supervisor expects of you.  Advocates of remote work sometimes claim that it reduces the role of office politics and personal likes and dislikes (see the Goldberg article), which would suggest that people who were working at home would gain in this department.  

The survey also contained the standard demographic variables.  I compared the preferences for frequency of remote work (5=all.....1=none).  Women were more favorable than men (3.77 vs. 3.61).  Blacks were more favorable than non-Hispanic whites (3.9 vs. 3.66).  For other ethnic groups, the confidence intervals were large, but the means were closer to the white mean than the black mean (they ranged from 3.6 to 3.73).  More educated people were less favorable to remote work--for all categories below a 4-year degree, the means were over 3.8, for a 4-year degree 3.74, and for a graduate degree 3.47.  Age, region of country, and living in a metropolitan area didn't make much difference.   There were also a few political variables--since so many things have become partisan issues, I figured I should look at those.  There was no clear pattern--people who said they were "very conservative" were more favorable to working from home, but there was no association with opinions on the handful of political questions in the survey.  

The obvious explanation for the differences in preference by gender is that women are expected to do more in taking care of the home and family, so they value flexibility more.  Explanation of the black/white and educational differences is as straightforward--I'll discuss those in my next post.  

*If the sampling procedures for the survey were clearly described, I wouldn't discount it just on the basis of its sponsorship.  But the description is vague and doesn't suggest that it was conducted by an organization with experience in survey research.  


[Data from the Roper Center for Public Opinion Research]

Friday, September 2, 2022

Generation to generation

 A couple of things following up on my last post:

1.  A comment asked about the possibility of changes in the dispersion of responses (people saying they are a lot better or worse off than their parents).  If we combine years into three groups:

                          much   somewhat    same    somewhat    much   
                         better     better                       worse          worse

1994-2000         33%     32%           22%      10%          3%

2002-2008         34%      32%          21%      10%          3%

2010-2021         28%      30%          25%      13%          5%

The distribution is almost the same in the first two periods.  Assessments are less favorable in the third, with little or no change in dispersion.

2.  In 1981, a Washington Post survey asked "Think of your parents when they were your age. Would you say you are better off financially than they were or not?"  Similar questions have been asked by the Post and other surveys, some offering just the two options, some offering three (better, worse, or the same).  It appeared to me that proportion saying better didn't change depending on whether there were two or three options--that is, people treated "not" as meaning "the same or worse."  The figure gives the percent saying "better off":      


There are some mysterious differences between surveys taken at about the same time, but there are also some clear trends.  As with the GSS, there is a decline in the 21st century.  The figure also shows that recent opinions are less positive than opinions in the early 1980s, when the economy was in recession.  However, a majority chose "better" at all times except the last one (2017).  That survey started off with four questions about finances before asking the one about comparison with parents.  Those questions included one about concerns about not saving enough for retirement, which is a point on which a lot of people are worried.  So I think the context pushed people in a negative direction.  But even on that survey, the balance was positive:  47% said they were better off and 29% said they were worse off. * Overall, I think this supports my conclusion from the GSS question:  assessments are not as favorable as they used to be, but are still favorable.  


*There was a question from 1980 that found 42% saying they were better off and 33% saying that they were worse off.  However, it didn't specify "at the same age" so I did not include it.  

Monday, August 29, 2022

Those awful elites

 Thomas Edsall had a column about threats to democracy, particularly in the United States.  He suggested that the problem wasn't just elite behavior, but also declining popular support for democratic institutions, and quoted various experts on why that might be happening.  One idea that several proposed was that the public was reacting to failures of economic policy.  According to Daron Acemoglu, an economist:  "both center-right and center-left politicians promised huge gains from globalization and technology for everybody, and aspirations rose. And many groups were disappointed and frustrated with either slow or sometimes no economic progress."  Jack Goldstone, a sociologist:  "more rigid and culturally divided inequality breeds resentment of the elites. And I would say the elites brought this on themselves, by creating meritocratic bubbles that demean those outside and access to which they increasingly control for their own families. The elites have implemented policies of globalization, meritocracy and market-driven morals ... while ignoring the widespread harm these policies have done to many millions of their fellow citizens."  And Elizabeth Suhay, a political scientist: "elites are an indirect cause of the rise of authoritarian parties. The neoliberal policies they have championed have led to increased inequality, stagnating wages and a weaker safety net for most citizens. Economic distress, pessimism and precarity increase citizens’ interest in radical political candidates and policies on both sides of the political aisle."  The common theme is that the prevailing policies have been good for elites but not for the general public, so ordinary people turned against, not only those policies, but the elites who had pushed them.

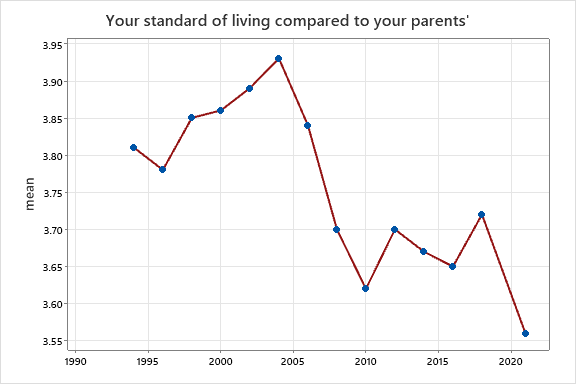
The common assumption behind these accounts is that people have become discontented with their general economic prospects:  that they don't feel like they're making progress, or are making progress in the future.  Is this true?  There are lots of survey questions about current economic conditions, but not as many on general evaluations of your life.  However, the General Social Survey has included this one since 1994:  "Compared to your parents when they were the age you are now, do you think your own standard of living now is much better, somewhat better, about the same, somewhat worse, or much worse than theirs was?"  The means*, counting "much better" as 5, "somewhat better" as 4, and so on:


It generally rose until the early 2000s, and then declined.  It started falling before the "Great Recession" and never really bounced back--in 2018, it was only slightly above the 2008 level.  (It hit a low in 2021, but that could reflect disruptions of life caused by the pandemic.

Breaking it down by some demographic groups:


In the 1990s, non-graduates had slightly more positive assessments than college graduates, but they have fallen behind since the early 2000s.


No clear difference between men and women in terms of the changes.


Also no clear difference by race.**  There's a good deal of sampling variation in the estimates for blacks, so it's hard to say about short-term changes.  But there's no general tendency for one group to pull ahead of the other.  


There are differences by age group.  Despite what people often say, it's was the older age groups that saw themselves slipping:  in 2018, people aged 25-39 were more likely to see themselves as ahead of their parents than people aged 25-39 had been in 1994 and 1996.  The assessments of young people became considerably more negative in 2021, but again that could be a short-term reaction to the pandemic.  

These results support the accounts given above in two respects:  there's been a general decline in the 21st century that doesn't track immediate economic conditions, and it's been more pronounced among less educated people.  But if you look at the values on the y-axis, they are all well above 3.0:  that is, in all groups at all times, the prevailing opinion is that their life is better than their parents was at the same age.  For example, in 1994-2000, 65% of people without college degrees said that they were ahead of their parents' standard of living and only 13% said that they were below.  In 2010-21, that had slipped to 59% ahead and 15% below, but that's still a solid margin on the optimistic side.  The changes are also pretty small--there have been occasional questions about expectations for the next generation, and those have shown much larger changes.  So overall, I think that there is an anti-elitist mood today, and it often shades into an anti-democratic mood, but I don't think that it results from dissatisfaction with one's own economic situation.  


*All of the figures are limited to people born in the United States.  

**I just show black and white--the number in other races is too small to be informative.  


Monday, August 22, 2022

Citation analysis

 The New York Times recently had a story called "Pain in children is often ignored.  For children of color, it's even worse."  That story mentioned "an often-cited study published in 2016 in the Proceedings of the National Academy of Sciences" on pain treatment recommendations.  It turns out that I blogged about that article a few years ago.  When I checked, I found that it had 1404 citations in Google Scholar.  Articles in medicine and public health tend to be cited at high rates, but that's still a lot.  However, that's not what this post is about, it's just how I got started.

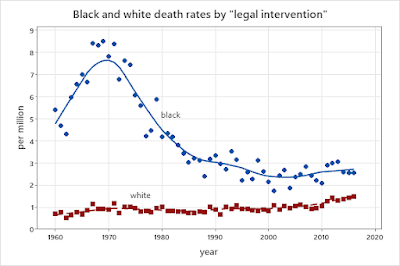
I read one of the articles that cited the PNAS paper and found a reference to a study of trends in killings by police between 1960 and 2010.    There are several recent data sets on police killings, but I didn't know that there was any historical data at the national level, and assumed that there wasn't any (see this post for some data on New York City).   The study used data from death certificates, which include a category for "legal intervention" (formerly "injury by intervention of police"). They just considered men aged 15-34, so I went back to the original data. The 1968-2016 data are available from the National Center for Health Statistics, which has a convenient online tool, and the older data are in annual issues of Vital Statistics of the United States. The basic figures:


For example, in 1960 125 white people and 119 non-whites were recorded as dying from "injury by intervention of police."  There were about 175 million whites and 17 million blacks, giving about 0.7 deaths per million among whites and 5.4 million among blacks.  The black rate is slightly overestimated, since some of the non-whites were not black, but the effect is probably small (in 1968, they shifted to black, white, and "other race," and there were only 3 in "other race").  

The rate of deaths among blacks rose in the 1960s, but then declined and has remained about the same in the 21st century.  The original study just reported data with minimal interpretation, but the paper that cited it (published in the New England Journal of Medicine and cited 478 times since its publication in 2021) said "the late 1960s also saw a massive spike in police killings of Black men," and didn't mention the decline after 1970.

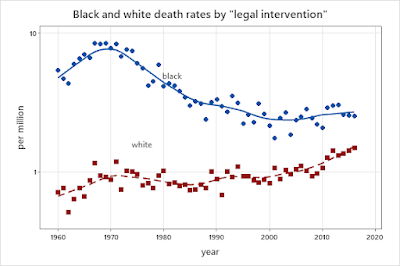
The rate among whites looks like it has increased pretty steadily--in order to see it more clearly, here's the same graph with a log scale:


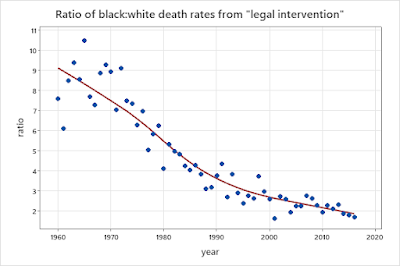
 If you look at the ratio of black to white death rates, it shows a long-term decline, from more than 8:1 in the 1960s to less than 2:1 in the latest years for which data are available (2014-16). 


Methodological appendix:  The death certificate data shows only about 500 deaths from "legal intervention" in the mid-2010s.  The data on deaths from police, which start at about that time, show at least 1,000.  My guess is that death certificates sometimes just give the physical cause of death--e. g., say that a person died from a gunshot wound and don't mention who fired the shot.  The rate of incomplete reporting could change over time and differ among races, and the racial differences could change over time.  So clearly these data aren't definitive, but they have potential.  Someone should do a more thorough analysis.    


Wednesday, August 17, 2022

Confidence in institutions, 1999-2022

 The latest round of Gallup data on confidence in institutions is out.  Confidence is down across the board, with especially large declines for the Supreme Court and the presidency.  Gallup also reports the breakdowns by party identification.  Republicans have most confidence in small business, the military, and the police, and least in newspapers, Congress, and the presidency; Democrats have the most in the military, small business, and the presidency, and the least in the Supreme Court, big business, and Congress.  I wanted to see if the pattern had changed, so I looked up the 1999 data.  (Small business was not included in the 1999 survey).  Among Republicans, the relative position of different institutions was very similar in 1999 and 2022, with a correlation of 0.93.  There was more change among Democrats, with a correlation of only 0.59.  

The correlation between Republican and Democratic confidence in different institutions fell from .66 in 1999 to .29 in 2022.  The gap between parties increased, with the average absolute difference going from 10.5 to 19.5.  The figure shows the partisan gap (absolute value of percent Democrats approving minus percent Republicans approving) for individual institutions.


The diagonal line indicates identical values in the two years:  for example, in 1999 43% of Democrats and 31% of Republicans had a great deal or quite a lot of confidence in TV news, for a difference of 12, and in 2022, 20% of Democrats and 8% of Republicans did, again giving a difference of 12.*   The partisan gap has stayed about the same for criminal justice, big business, Congress, banks, the military, organized labor and TV news, and grown for the Presidency, police, schools, the Supreme Court, organized religion, the medical system, and newspapers.  It seems that confidence in "the presidency" has become more closely linked to feelings about the current president--37% of Republicans had confidence in the presidency in 1999, down to 12 percent in 2021 and only 2 percent in 2022.  Democratic confidence in the Supreme Court has declined dramatically, from 57% in 1999 to 13% in 2022.  But the change is not symmetrical:  Republican confidence has also declined, although by not nearly as much.  Democratic confidence in the police and organized religion has declined, while Republican confidence has stayed about the same; Republican confidence in newspapers has declined, while Democratic confidence has stayed about the same.  

Republican confidence in schools stayed about the same until 1999, but has declined since then, including a drop from 20 to 13 percent from 2021 to 2022.  Democratic confidence has remained about the same over the period.  With the medical system, confidence declined among both Democrats and Republicans from 1999 to 2009--since then, it's continued to decline among Republicans but increased among Democrats.  I wonder if that is because of the Affordable Care Act?  Finally, Republican confidence in organized labor was slightly lower in 2022 than in 1999, despite their growing interest in being a "working class party," or at least talking about being one. (Democratic confidence was almost unchanged).  

Both the decline in the correlation between Democratic and Republican ratings and the rise in partisan gaps can be regarded as a decline in consensus or a growth in polarization.  The changes in the gaps for individual items are interesting, and I may look at some of them in more detail in the future.  But the point that I find most striking is the much greater stability of rankings among Republicans.  One reason for that was that the changes among Republicans were more uniform, and another one was that Republican lost more confidence in institutions that they already disliked.  In contrast, some of the biggest losses among Democrats were for institutions in which they had fairly high confidence in 1999 (Supreme Court, organized religion, the police).

*The decline among Republicans is larger in percentage terms:  about 75% compared to about 50%.  You could adjust for that by using logits, but that doesn't change the general conclusions, so I stayed with percentages in order not to make things more complicated.  

[Data from the Roper Center for Public Opinion Research]