Tuesday, November 29, 2022

Representation

 A few weeks ago, I had a post on opinions about whether the Supreme Court should consider public opinion when making decisions.  There was a strong relationship to education:  more educated people are more likely to say that it should just consider the legal issues, while less educated people are more likely to say that it should consider what the public thinks.  There's a similar question that applies to elected officials--should they do what their constituents want, or should they use their judgment about what is in the best interests of their constituents?  

Although this is a classic issue in political theory, I could find only one relevant survey question, from 1993:  "When your representative in Congress votes on an issue, which should be more important:  the way that voters in your district feel about the issue, or the Representative's own principles and judgment about what is best for the country?"  70% said the way that voters feel, and 23% said the representative's principles and judgement (3% volunteered that it should be both and 4% said they didn't know).  In contrast to opinions about how the Court should decide, opinions on this issue had little or no connection to education (if there's a relationship, it's curvilinear, with people at middle levels of education most likely to favor going with the voters). Opinions had some connection to political views, with liberals and people who had voted for Clinton more likely to favor representatives using their own judgment--but even they had solid majorities in favor of following the voters.  

While searching for questions, I found one from 1992 on a related issue:  how representatives should vote on choosing a president if there was no Electoral College majority (in the summer of 1992, Ross Perot was running about even with Bush and Clinton, so this seemed like a real possibility).  The options were voting for the candidate who got the most votes across the nation, the state, or the congressional district, or voting for the one who they thought would make the best president.  Opinions on this question were related to education:  people with more education are more likely to say they should go with the district and less likely to say they should vote for the candidate who they think would make the best president (the other two options are about equally popular among all educational levels).  It's a strong relationship:  support for following the district goes from about 8% among people with no college to 30% among college graduates; support for choosing the candidate who they think would make the best president goes from about 45% among people with no college to 20% among college graduates.

So when thinking about the Supreme Court, more educated people are less likely to favor the "populist" position; when thinking about elected representatives, that's not the case.  Why?  The Supreme Court justices have an area of specialized expertise--interpreting the law.  Elected representatives don't have any definite area of expertise--if they have any advantage over the public, it's general judgment and experience.  It seems plausible that education increases respect for expertise, but not for claims of superior judgment and experience (if anything, it may increase confidence in your own judgment, so you're less likely to defer to others).   The difference in the relation of education to opinions about votes on the issues and votes on the president is puzzling, but it could be that educated people have a better understanding of how the process would probably work--in practice, voting for the candidate they think best would mean voting for the candidate of your party.  Given a choice between voting by party and voting by the wishes of their district, the second seems more fair.  But overall, I think these results support my suggestion that distrust in politics is distinct from distrust in experts.

[Data from the Roper Center for Public Opinion Research]

Sunday, November 20, 2022

Who has changed?

 People with more education used to be more likely to vote Republican than people with less education.  Things have now reversed, so more educated people are less likely to vote Republican.  Is that because more educated people have moved towards the Democrats, or less educated people have moved towards the Republicans, or some of both?  The figure shows average party identification in the General Social Survey, 1972-2018 (I limit it to whites, because the black vote is overwhelmingly Democratic and there's never been a clear educational divide).  

Republicans are 3, Independents 2, and Democrats are 1, so an average of 2.0 means equal numbers of Democrats and Republicans.  Between 1972 and 1990, both college graduates and people without college degrees moved towards the Republicans, at about the same rate.  Since the 1990s, the groups have diverged:  college graduates have moved towards the Democrats, while people without college degrees have stayed about the same.

So the reversal of the "education gap" has been mostly the result of changes among more educated people.  Of course, there may also be currents of opinion that affect people of all educational levels, so it's possible that the changes among college graduates reflect the general current of opinion, while the changes among less educated people reflect the general current plus some offsetting factor.  

However, the practical implications of the two interpretations aren't too different.  Either Republicans should be concerned about the trend among educated people, or they should be concerned about the general current.  Either way, it means they should be concerned about stopping their losses among educated people, whether that's by specifically appealing to educated people or by appealing to people in general.  But that doesn't seem to be the case--as I've mentioned before, they seem to be fascinated by the idea that they can win by becoming a "working-class party" (see this piece by Josh Hawley for an example), and uninterested in winning back educated voters.    


Sunday, November 13, 2022

Law and public opinion, part 2

 It took a while, but I am returning to a question I wrote about in a previous post:  ""When the Supreme Court decides an important constitutional case, should it only consider the legal issues, or should it also consider what the majority of the public thinks about that subject?"  It was asked in 1987, 2005, 2013 (twice), and 2015.  In my previous post, I noted that there was a strong relationship to education:  more educated people were more likely to say it should only consider the legal issues.  I also noted that support for the "legal issues" option seemed to be increasing.  Now I want to connect those, by considering the relationship between education and opinions at three different times, 1987, 2005, and 2015.  On the average, educational levels have been rising as older generations are replaced by more educated younger ones, so it's reasonable to ask if the increase in support for "only consider the legal" issues just reflects rising levels of education--in fact, it's possible that support has been declining within educational categories.  There's also a question of whether the educational differences have remained constant.  The following table gives opinions in the form x-y, where x is the percent saying "only legal issues" and y is the percent saying consider what the majority thinks--they add to less than 100 because some people said that it should be some of both:

                                             1987                2005              2015

No HS diploma                   15-81                23-72             29-69
HS only                               26-70                40-57             43-54
Some college                       39-59                57-39             60-37
College grad                        62-35                66-29             74-24

There was a strong relationship to education at all three times, but support for the "only legal issues" option rose in all educational groups.  As I mentioned before, the 1987 figures may have been affected by the context--the survey was taken during the nomination of Robert Bork, who seemed to delight in taking unpopular positions--but there was also an increase from 2005 to 2015 in all educational groups.  Also, there was little or no relationship between opinions and partisanship in 1987--to the extent that support for "only legal issues" was a reaction against Bork, you'd expect it to be more popular among Democrats.   (There was also no clear relationship to partisanship in 2005;  Republicans were a little more likely to favor considering the majority in 2015).  

Many accounts of recent politics hold that there's been a shift towards "populism" in a broad sense--a belief that the public should decide directly rather than leaving it to experts and authorities.  There's certainly some evidence supporting that, particularly the decline in confidence for most institutions.  

 There have been a few questions about the power of the Supreme Court over the years.  In 1957, Gallup asked "Some people say that the Supreme Court has too much power these days.  Do you agree or disagree with this?"  Then in 1982 a CBS News/NY Times survey asked " Some people think the Supreme Court has taken too much power that should belong to the President and Congress. Other people think the Supreme Court has been carrying out its proper responsibilities under our system of government. Do you think the Supreme Court has taken too much power, or is it carrying out its proper responsibilities, or don't you know enough about this to have an opinion?"  Finally, starting in 2015, the Pew Research Center has asked "Do you think the US Supreme Court has too much power, too little power, or the right amount of power?"  They're not identical, but seem similar enough that a comparison is reasonable.  The results:

                Too much        Not too much

1957                26%                    53%
1982                17%                    39%
2015                36%                    61%
2019                21%                    74%
2020                33%                    65%
2022 (Jan)        41%                    58%
2022 (Aug)       45%                    53%

Belief that it had too much power has increased in the last few years (interestingly, it was almost as high in January 2022 as in August), but didn't show much trend before then.  So, as I've suggested before, the decline in institutional confidence might involve a distrust of politics rather than a distrust in "experts". 

[Data from the Roper Center for Public Opinion Research]
Friday, November 11, 2022

How good was it?

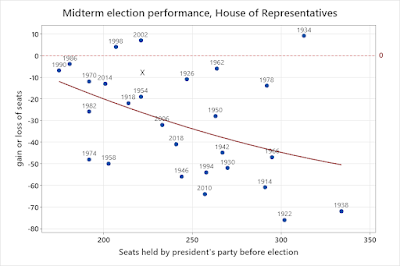
The President's party almost always loses seats in midterm elections.  But is it normal to lose a lot of seats, or do people just remember those cases better than those in which the president's party loses a few seats?  That is, did the Democrats have an outstanding performance this year, or just a pretty good one?  I looked at all midterm elections since the House of Representatives went to 435 members (1914 was the first).  The mean loss of seats was 31; the median was 28.  It looks like the Democrats will lose 5-10 this time, which would be the 6th or 7th best out of 28.  But we should also consider the starting point--when you come in with a lot of seats, it's hard to gain and easy to lose.  The figure plots the change against the number of seats the party had in the previous House:


"X" is the approximate location of the 2022 election.  Whether or not you consider the number of seats coming in doesn't make much difference for 2022--either way, it's a good but not exceptional performance.  But it makes a significant difference in some cases:  the big losses for the Democrats in 1966 were a normal performance and the small losses in 1978 were an unusually good one.  I'm not old enough to remember the 1966 election, but I do remember 1978 (it was the first election in which I was eligible to vote) and I had thought of it as a very bad year for the Democrats.  I think that's partly because the late 1970s were a conservative period in some respects (e. g., Proposition 13 passed in 1978), and partly because the Carter administration ended in failure, so there's a tendency to remember it as an unbroken series of failures.  Similarly, I had remembered 2006 as a bad year for the Republicans, but their losses were only a little worse than you could expect.  Like Carter, Bush ended badly, and that colors the memory of everything that happened in his presidency.  And 1934 is a much more impressive accomplishment than 2002 or 1998, although all three involved similar gains for the incumbent party.  

Tuesday, November 8, 2022

Predictions

Although I study public opinion, that doesn't give me any special insight as far as election predictions are concerned.  With public opinion on any topic, there are lots of questions you can and should consider, and differences of a few percent either way don't matter much.  But with elections, there's only one question that matters--the choice of candidates--and differences of a few percent are important.  Moreover, the results don't depend on public opinion, but on the opinions of the voters.  So predicting elections involves questions about predicting who will vote and identifying and adjusting for relatively small "house effects"--tendencies for particular polls to over- or under-estimate support for different parties--and then you have questions about translating votes into seats.  Still, it's fun to try, so here are my predictions:
Senate 51R-49D
House  235R-200D

In this election, people are also concerned about how the outcome will affect the future of democracy.  The study of public opinion should provide some insight into that.  There are several reasons for optimism:
1.  An independent judiciary with a long accumulation of precedent.   Trump and his allies lost almost all of the lawsuits that they filed over the 2020 election.
2.    Bureaucracy.  There are a lot of agencies that have routines which are based on a combination of laws, regulations, and tradition.  Even if political officials want them to change direction, they will continue to try to follow those routines.  The routines generally involve following relatively impersonal rules, so bureaucracies usually resist demands to "reward friends and punish enemies" or manipulate statistics to make the party in power look better.  This is connected to point 1--in many cases, routines are based on an interpretation of legal requirements.
3.  Political culture.  Americans don't generally take to the streets to protest.  After the 2006 election in Mexico, their were several months of protests by supporters of the defeated candidate, Andrés Manuel López Obrador.  According to Wikipedia,  "López Obrador and his supporters began organizing mass protests, marches, and civil disobedience, culminating in a massive rally in Mexico City's historic Zócalo on 30 July 2006. Estimates of the crowd at the rally range from 500,000 to 3,000,000 supporters.[34] Additionally, López Obrador's campaign set up plantones, or encampments, inside the Zócalo and along Paseo de la Reforma, one of Mexico City's main arteries, for 47 days and slowing traffic for hours."  Estimates of the number at Trump's January 6 rally range widely, but the upper end seems to be 80,000, and that was a one-time event--there were no mass protests before or after.  This is also connected to point 1:  even people who wanted to overturn the results of the election focused on legal or quasi-legal efforts like "forensic audits."  At some level, Americans have a lot of respect for the political and legal system:  the remedy for injustice is appeal to some higher authority (real or imagined) rather than violent resistance.

On the other side, there is a reason for pessimism:  the complexity of the American electoral system provides a lot of opportunities to spread doubt about unfavorable results and manipulate the rules to the advantage of your side.  So people can undermine democracy without taking a definite stand against it--in fact, they can undermine democracy while imagining that they are upholding some higher value (like the rule of law or the Constitution).  Also, long tradition, combined with the difficulty of constitutional amendments, makes it hard to make changes in election procedures--e. g., attempts to have more uniform standards for elections are denounced as "a federal takeover," and reforms like multi-member districts are not even considered.

The result is that there is little danger of a coup, or the suspension of elections, or jailing of opposition candidates.  But there is serious danger that government will continue to be ineffective and unresponsive, or even get worse.  

Wednesday, November 2, 2022

Conjectures and refutations

Earlier this year, I had a post about a survey of college students on free speech issues.  Students at more selective universities (measured by the admissions rate) were more willing to accept controversial speakers.  I suggested two possible explanations:  "it could be because they are more liberal, and liberals tend to be more favorable to the principle of free speech, or because they are more intellectually sophisticated, and more intellectually sophisticated people are more favorable to the principle (or some mix of both)." I couldn't test those ideas, because I didn't have information about ideology.  However, there's an updated version of the survey, and I obtained a copy of the data from the sponsor (the Foundation for Individual Rights and Expression).  That contains a question about ideology (very conservative to very liberal, plus options for "haven't thought about this" and other), making it possible to see how it is related to tolerance for speakers.  

The hypothetical speakers include four right wing examples--abortion should be completely illegal, Black Lives Matter is a hate group, the 2020 election was stolen, and transgender people have a mental disorder--and four left-wing examples:  the 2nd Amendment should be repealed so that guns can be confiscated, undocumented immigrants should be given the right to vote, white people are collectively responsible for structural racism and use it to protect their privilege, and religious liberty is used as an excuse to discriminate against gays and lesbians.  For each one, respondents were asked if the speaker definitely should be, probably should be, probably should not be, or definitely should not be allowed.  

Here is the relationship between admission rate and tolerance of the two types of speakers:


The figures for left-wing speakers are in red and those for right-wing speakers are in blude.  I indicate a few universities and colleges by name:  Chicago, which is among the most tolerant of both; Hillsdale, which is by far the most tolerant of right-wing speakers; Smith, which is the least tolerant of right wing speakers; and Wyoming, which is the least tolerant of left-wing speakers.  One point that stands out is that there is less tolerance of right-wing speakers--in fact, only one of about 200 colleges surveyed (Hillsdale) is more tolerant of right-wing than of left-wing speakers.  Of course, the examples can't be exactly parallel, so you could argue that in some sense the right-wing ones are more extreme.  But the same gap, with about the same magnitude, appeared in the previous survey.  

Moving on to the relationship with selectivity, more selective places are clearly more tolerant of left-wing speakers.  They are slightly less tolerant of right-wing speakers, although it seems like the relationship may be non-monotonic, with the lowest tolerance occurring at moderately selective schools (those that accept about 30% of applicants).  

If you add tolerance of left and right-wing speakers together, more selective schools are more tolerant:

It seems to be a non-linear relationship, with little difference from about 30-100% and rising as the admission rate goes toward zero.  If you regress overall tolerance on the admission rate, the t-ratio is about 6; if you regress it on the inverse of the admission rate, the t-ratio is about 7.6.   

What about ideology?  More selective schools are more liberal:


The average ideology (weighting the schools equally) is 3.0, which is more liberal than the general public aged 18-23 (3.7 in 2021, according to the GSS, which has an almost identical question on ideology).  Among the most selective (admission rate of less than 20%), 26% say they are very liberal, 39% somewhat or slightly liberal, 11% moderate, 12% slightly, somewhat, or very conservative, with 3% no opinion and 7% other.  But even at the least selective, they generally lean to the left:  at those with admission rates of 80-100%, 44% are some variety of liberal, 16% moderate, and 26% some variety of conservative.

What about the relationship between ideology and tolerance?  


I also include the people who didn't place themselves on the liberal-conservative scale.  People who said that they were neither liberal nor conservative were asked a follow-up question giving three options:  democratic socialist, libertarian, and other.  Within the liberal to conservative categories, there is a tendency for conservatives to be more tolerant.  But the people who said they "haven't thought about it" are the least tolerant.  As I said before, tolerance isn't a natural state--it's something that people need to be persuaded to accept.  

One of my hypotheses about the relationship between selectivity and tolerance--that it results from ideological differences--is refuted.  The survey doesn't contain any question that could reasonably be regarded as a measure of intellectual sophistication.  However, while there are certainly individual exceptions, it seems safe to say that on the average students at more selective universities are more intellectually sophisticated than those at less selective ones.  So the other hypothesis--that intellectually sophisticated people are more tolerant--is consistent with the data.  

I found a number of other interesting things in the data, so I will return to it in a later post, after I get to a few other things which I've been meaning to write about.  

[Thanks to the Foundation for Individual Rights and Expression for providing the data]