Friday, March 31, 2023

Transvaluation of some values

 The values poll continues to get attention--since my last post, I've seen three New York Times columns discussing it (Ross Douthat, Peter Coy, David Brooks).  In the Dispatch, Nick Catoggio calls it >the hottest topic in political commentary."  My last post discussed specific issues with that survey--this one will address the general question of changes in values.

1.  What has happened:  In the 21st century, there's clearly been a turn away from religion in the United States, although you can argue about whether it's a new thing or the continuation of a longer trend.  For example, the Gallup Poll has a question on whether "religion can answer most or all of today's problems," which was asked in 1957, 1974, and pretty regularly starting in the 1980s.  The results through 2017:


It was asked again in 2018 and agreement fell below 50% for the first time.   There's also been a decline, or at least a moderation, of patriotism.  I wrote about questions comparing the United States with others in this post.  One of those questions was asked in the recent WSJ poll:  21% said it "stands above all countries in the world," 50% that is is "one of the greatest countries in the world, along with some others, and 27% said "there are other countries better than the United States."  When that was first asked in 2011, the numbers were 38%-53%-8%; in 2018 they were 24%-55%-21%.  Finally, there's also been a decline in the belief that people need to have children in order to have a full life.  I don't think I've posted on that, but it's pretty clear.  

2.  What hasn't happened:  a dramatic change in values since 2019.  This was one thing that brought attention to the survey, and made it especially appealing to the right.  From their point of view, most of the big developments since 2019 have been bad--the response to Covid, the rise in "wokeness," most of the policies of the Biden administration.  So evidence of a general collapse in values fit with their sense that things had gone badly wrong in the last few years.  But rapid changes in opinions are rare, and some of the apparent changes in the WSJ polls just aren't credible (e. g., a fall from 80% to 58% rating "tolerance for others" as very important).  So they are probably the result of the change in survey procedures.  Although social desirability bias may be a factor, I don't think it's a big factor with these opinions, especially when it comes to the difference between "very important" and "somewhat important."  But in addition to the issue about response order I mentioned last time, I think the chance that people will be careless or not take the survey seriously is greater in online surveys.  The documentation to the survey mentions that they removed about 5% of the surveys because of high rates of non-response, completing the survey too fast, or "straight-lining all grid questions."  But it seems likely that attention and effort are matters of degree, so that if 5% were clearly not paying attention, some larger number were not paying much attention.   It's hard to say exactly what affect this would have--it just means that we can't be sure about how much of the apparent change is real.  

3.  What's uncertain:  how much people value obligations to their family versus their own interests, or money versus other goals.  I think that there's a long term trend towards emphasizing non-material goals (like wanting a job that's fulfilling or does good for the world), but I'm not really confident of that.  The focus on money also goes up and down depending on short-term economic conditions, making it harder to distinguish any trend.  People clearly feel less obligation to get married and have children, but beyond that--for example, whether parents are more or less willing to sacrifice for the benefit of their children--it's hard to say.  I will look for other questions and write about them in a future post.  

Tuesday, March 28, 2023

What's wrong?

 A series of questions from a new survey sponsored by the Wall Street Journal is getting a lot of attention.  The figure that's been circulating shows the percent who says that the following values are very important "to you personally" in surveys taken in 1998, 2019, and 2023:


So it appears that patriotism, religion, having children, and community involvement are becoming less important to people, while money is becoming more important.  The WSJ story on the survey also mentions that the percent who say that tolerance and hard work is very important to them fell between 2019 and 2023.  So the results seem to show a dramatic turn towards selfishness in the past few years.

A few people have raised questions about this interpretation.  Patrick Ruffini notes that the 1998 and 2019 surveys were taken by telephone, while the 2023 survey was online.  He suggests that phone surveys are affected by "social desirability bias"--you want the interviewer to think well of you, so you give answers that will make you look better.  Social desirability bias might have inflated the numbers for values like hard work, patriotism, and community involvement, and held down the numbers for money.

Another new feature of the 2023 poll was that half of the sample were asked the response options ("very important," "somewhat important," "not that important," and "not at all important") in reverse order (see p. 7 here).  This may also make a difference--making a distinction "very important" and "somewhat important" may be harder than making a distinction between important and not important.  In this case, whether people say "very" or "somewhat" may depend on which answer is offered first.  In the phone surveys, "very" was always offered before "somewhat"--in half of the internet surveys, "somewhat" came first.  So my hypothesis is that the distribution of answers in 2023 differed depending on the order of the response options.  If so, comparison with the earlier years should be based only on the part of the sample that offers them in the same order as the phone surveys.  

Or you could look at the the combined percentages for "very" and "somewhat" important:

                                        1998    2019   2023
Hard work                         98%    98%   94%
Self-fulfillment                  94%   94%   91%
Tolerance                           NA     96%   90%
Money                                 88%   92%   90%

Community involvement   94%   96%    80%
Patriotism                           93%   88%    73%
Children                              84%    77%   65%
Belief in God                      NA     72%    65%
Religion                              89%    75%   60%

For the first four, there's little change--they are almost universally regarded as important at all three times.  The results for "self-fulfillment," which isn't mentioned in the WSJ article, are particularly interesting--the percent rating it as very important fell from 64% in 2019 to 53% in 2023.  That's hard to square with either the growing selfishness or the social desirability interpretations, but is consistent with my hypothesis.  These figures indicate some changes in the last few years, but not the general collapse of values that is being claimed.

Unfortunately, the Wall Street Journal doesn't make the original survey data available.  If they ever do, I will check and see if the response order makes a difference.  

Monday, March 20, 2023

Wokeness

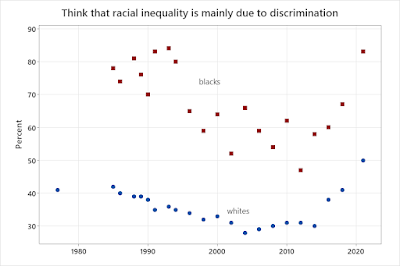
 There have been numerous efforts to define "woke" in the past week or two.  A common problem with the ones I've seen is that they have been too elaborate, treating it as if it were a political ideology rather than general current of opinion.   I would define it as an inclination to think that discrimination is the primary cause of group inequalities (except when a generally favored group is on the bad side, as with men being overrepresented in prison).   

With this definition, we have a question that can be used to measure the growth of "wokeness." The General Social Survey asks:  "On the average (negroes/blacks/African-Americans) have worse jobs, income, and housing than white people. Do you think these differences are mainly due to discrimination?" 


Agreement was generally declining among both whites and blacks until about 2014.   but there have been large increases in 2016, 2018, and 2021.  White agreement is at its highest level ever, and black agreement is almost equal to its highest level.   Of course, opinions are affected by experience and other evidence, but those haven't changed dramatically in the last ten years---that leaves what I called the "inclination."   Ibram X. Kendi's remarks are interesting in this context:  "The racist answer is 'no'—it presumes that racist discrimination no longer exists and that racial inequities are the result of something being wrong with Black people. The anti-racist answer is 'yes'—it presumes that nothing is wrong or right, inferior or superior, about any racial group, so the explanation for racial disparities must be discrimination."  That is, he doesn't appeal to evidence, but to principle:  "presumes" and "must be."

The previous figure showed that the turn towards wokeness occurred among both blacks and whites.  It also occurred among both more and less educated whites, although it was stronger among college graduates:


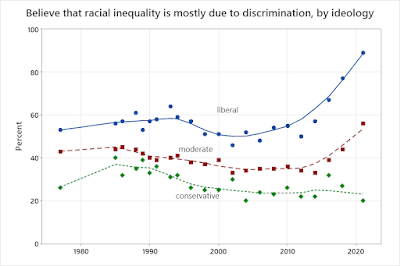
This is normal--usually changes of opinion are similar among different groups, although there may be subtle differences.  But the pattern by ideology is different:


The GSS asks people to rate their ideology on a seven-point scale:  I divided it into three groups, very and somewhat liberal; slightly liberal, moderate and slightly conservative; and somewhat and very conservative.  Liberals and moderates have both moved substantially towards agreement, but there has been little change among conservatives.  There's a good deal of sampling error in year-to-year changes in subgroups, but agreement rose among conservatives between 2014 and 2016, but then declined in 2018 and 2021.  

So the division over "wokeness" is not just something that has attracted the attention of political elites and people on Twitter:  it is clearly visible in the public.  


Wednesday, March 15, 2023

'Twas a famous victory

 In September 2015, a Pew survey asked "Thinking about the way things are going in politics today...on the issues that matter to you would you say your side has been winning more often than it's been losing, or losing more often than it's been winning?"  The question has been repeated a number of times since then, most recently in September 2022.  The figure shows the percent who said that their side was generally winning broken down by party--the colors distinguish between supporters of the President's party (Democrats in 2015 and 2016, Republicans 2017-2020, and Democrats in 2021-2).  


Unsurprisingly, supporters of the President's party are more likely to think that they are winning than supporters of the opposition party are.  The unexpected part is that the views of supporters of the president's party are more variable--in the opposition party, "winning" ranged from 14-22%, which is probably not much more than would be expected from sampling variation; in the president's party, it ranges from 31% to 69%.  The highest value occurred in May 2019.  Trump supporters generally say that his greatest accomplishments were the tax bill, the confirmation of Supreme Court Justices, and the Abraham accords, and maybe the program to develop Covid vaccines, none of which occurred around that time.  The most plausible explanation for the positive feelings among Republicans is the release of the Mueller report, which was generally regarded as a political victory for Trump because it wasn't as damaging as many had expected.  On this interpretation, Republicans had the greatest sense of success after avoiding a loss rather than after a positive accomplishment, which shows the strength of negative partisanship.    


[Data from the Roper Center for Public Opinion Research]

Friday, March 10, 2023

Three kinds of polarization

I'll start by answering a question in a comment on my last post:  where can you get these data?  One way is to download the data from the American National Election Studies data center and then analyze them using a statistics program; the other is to analyze them online from the SDA (Survey Documentation and Analysis) site.  I use both, but usually SDA--it's faster for simple analyses.  

The ANES survey has thermometers for the parties, the presidential candidates, and liberals and conservatives.  A few years ago, I showed the correlation between ratings of the Democratic and Republican parties.  Here's the figure updated to include 2020:


There was a substantial drop between 2000 and 2004, and no consistent change since then.  That's kind of surprising, since the general perception is that polarization has increased substantially in the last 10-15 years.  

From 1964 to 1982, the ANES asked about ratings of Democrats and Republicans.  The correlations:

The first time it was asked was after the Johnson-Goldwater race, when there was large ideological gap between the parties.  But even if you leave that aside, polarization declined (since a negative correlation indicates polarization, an upward slope is a decline in polarization) from the 1960s to the 1970s.  

There are also thermometers for the presidential candidates starting in 1972:


In contrast to the questions on the parties, this shows a substantial recent increase in polarization.  The correlation between ratings of Trump and Biden in 2020 was -.787, which is remarkably high for individual-level data (the correlation between ratings of the parties in 2020 was -.48).  

Questions on liberals and conservative in 1964:


There isn't much trend through 2008, then a big increase in polarization in 2012, with smaller increases in 2016 and 2020. 

What I find most striking in these figures is that polarization was probably lower, and certainly not higher, in 2016 than in 2012.  The substantial increase between 2000 and 2004 is also noteworthy.  


Wednesday, March 1, 2023

I'm OK, you're OK

 A recent  Rasmussen poll asking people if they agree or disagree that "it's OK to be white" has gotten a lot of attention.  26% of black respondents disagreed, and 21% said they didn't know.  Scott Adams notoriously interpreted those results as meaning that almost half of black people are hostile to whites.  It's hard to say what they actually mean, since the statement is vague and open to a lot of different interpretations--13% of whites said they didn't know (and 7% disagreed).   But there's another question which measures feelings in a straightforward way:  the American National Election Studies "feeling thermometer" that asks people to rate their feelings on a scale of 0 to 100, with numbers over 50 indicating that you feel "favorably and warm" toward the group and numbers under 50 indicating that you "don't feel favorably . . . and that you don't care too much for that group."  Feeling thermometers for blacks and whites have been included regularly since 1964.  The figures show the average ratings of whites and blacks by race:


Among both blacks and whites, the rating for their own race declined until around 1990 and has stayed about the same since then.  White ratings of blacks have become steadily more favorable.  Black ratings of whites increased until about 2000, but have declined since then--it's hard to be sure about the timing since the black samples are small in most years, but there has clearly been a change in direction.  Still, even the latest black ratings of whites are mostly favorable (an average of 62), and about the same as the average rating of blacks by whites circa 1990.  Looking more closely at 2020, 4.5% of blacks rate whites at 0, and another 3.2 rate them at 20 or less.  On the other side, 13% of blacks rate whites as 97-100.  

The recent decline in black ratings of whites is interesting, and may be cause for concern, but favorable ratings are more common than unfavorable ones, and definite hostility is rare.


Friday, February 24, 2023

One more on the media

 While doing one of my recent posts, I looked at the Gallup report on their question about "trust and confidence in the mass media ... when it comes to reporting the news fully, accurately, and fairly."  That report showed changes by party identification*:

The obvious feature is the growth of polarization since the late 1990s--the partisan gap has gone from about 10-15 percentage points to 50-60.  I haven't kept a systematic record, but offhand I can't think of any opinion question that's shown a bigger increase in partisan polarization.  There are a couple of other things that are worth noting:  

1.  Like Republicans, independents show a clear downward trend.  As a result, they are now closer to Republicans than they are to Democrats.  In the 1970s and 1990s they were about midway in between Democrats and Republicans--in 2022, they were about three times as far from Democrat as from Republicans.  This may be because people (especially people who aren't that interested in politics) tend to react to controversy by concluding you don't know who you can believe.  As a result, it's easier to make them lose trust than to gain trust.  

2.  There is some tendency for people to be more positive about the media when a president of the opposite party is in power.  The strongest case is with Trump, when Democratic confidence increased substantially and stayed high while he was in office--it also rose under Bush and declined under Obama.  It's harder to tell with Republicans because the trend is so strong, but the decline in trust seemed to slow down or stop under Obama, and there's been a slight increase under Biden.  Probably this occurs because the president gets a lot of attention, and news stories tend to focus on negative things, giving supporters of his party more to object to (and opponents more sense that the media is doing its job).  

The second point leads to a question about short-term changes in opinion:  do the opinions of Democrats and Republicans move together or in opposite directions?  One possibility is that there are changes in the general quality of news coverage, and people of all parties react to them in the same way--for example, confidence might have declined as it became clear that many stories about "weapons of mass destruction" in Iraq had been inaccurate.  Then the opinions of Democrats and Republicans would move together, even though there would be a persistent difference between them.   This would be similar to assessment of current economic conditions--if unemployment or inflation increases, both Democrats and Republicans will rate the economy as worse.  Another possibility is that people react according to whether the news reflects well or badly on their side--for example, a negative story about Biden will cause Democrats to lose confidence and Republicans to gain confidence.  

To judge this, I computed the change from the previous year.  There was one case with a 21-year gap, which I discarded because change over a long period is dominated by the trend, and a few with a two-year gap, which I kept.  Comparing changes among Democrats and Republicans:


There is no association (the correlation is -.03), but it's not just noise--some of the individual changes make sense in terms of what was happening then.  In 2001 and 2009, supporters of the new president's party lost confidence in the media, and supporters of the other party gained.  In 2016, supporters of both parties lost confidence--presumably because of negative coverage of Trump for Republicans, and stories about Clinton's e-mails for Democrats.  In 2017, confidence in the media increased substantially among Democrats but also increased a little among Republicans, suggesting that some Republicans had qualms about Trump.  The changes among independents had positive correlations with both the changes among Democrats (.50) and Republicans (.21).  This pattern suggests that the changes are a mix of consensus and partisan reactions.  What if we looked at changes among independents to get a sense of the consensus part?  Sampling error has a large impact on those figures, but for what it's worth the biggest positive changes among independents are in 1974, 2017, and 2013; the biggest negative changes are in 2004, 2007, and 2012.


*The question has four possible answers, but the Gallup report collapses that into two, and the recent datasets aren't publicly available.