Sunday, March 28, 2021

Long delayed

 On December 21, 2020, Jennifer Senior had an opinion piece in the NY Times called "95 Percent of Representatives have a Degree.  Look where that's Gotten Us."  I was going to post something on that, but other things kept coming up, so I'm only now getting around to it.  Her point was that members of Congress are very well educated compared to the people they represent.  Moreover, she implied that the gap had been growing, and that this was partly responsible for the decline in public confidence in government.

A few years ago, I had some students collect data on the educational attainment of the 115th congress (2017-19),  and the 83d (1953-5).   As Senior observes, almost all members of Congress today are college graduates--in the 115th congress, 98%.  There were 8 members who had attended college but not received a degree and only one who hadn't attended college.  In the 83d congress, 80% were college graduates, 7% had attended but not graduated, and 13% hadn't attended.  There are two ways to look at this--one is that people without college have almost completely disappeared from Congress, but the other was that even in 1952-3, members of college had far more education than the general public.  To some extent, the increasing number of college graduates in Congress reflects changes in the general public--in 1950, only 7.7% of American adults were college graduates--today, 38.7% are.  The degree of over-representation has increased, from an odds ratio of about 48 to about 95.  To put it another way, if there were the same degree of over-representation in the 115th congress as the 83d, there would have been about 19 members without college degrees instead of 9.  In relative terms, this is a pretty big difference, but 19 out of over 500 would still be a tiny minority. 

When I collected these data, I was primarily interested in which colleges and universities members of Congress had attended.  I divided them into five groups--about 20 top private universities, about 15 top liberal arts colleges, about 10 leading public universities, all other "flagship" state universities, and all other colleges and universities.  The breakdown:

                                    83d        115th

Elite universities        14%            16%

Elite colleges                3%             2%

Top public                    7%              9%

Flagships                    20%            15%

Others                         43%            57%

None                            13%            0%

My idea was that there would be a substantial increase in the share from elite universities, but that didn't turn out to be true.  There was an increase in relative terms, because the proportion of people who are graduates of elite universities has declined (enrollment at elite colleges and universities has grown at a slower rate at the population), but in terms of the share of members of congress, there wasn't much change.  

The preceding discussion shows why I didn't try to publish anything with these data.  I thought there would be a clear and substantial increase in the educational level of members Congress, but there wasn't, partly because in the 1950s they had more education than I expected, and partly because the proportion from elite institutions today was lower than I'd expected.  There were some more subtle changes that might be interesting,  but there wasn't the big change that I expected.  Senior quotes the political theorist Michael Sandel, saying that in his view, "the technocratic elite’s slow annexation of Congress and European parliaments — which resulted in the rather fateful decisions to outsource jobs and deregulate finance — helped enable the populist revolts now rippling through the West."  But in the United States, the educational elite has only "annexed" Congress you define "elite" as people who graduated from college--and if you do, it accomplished that a long time ago.  

Note:  I just considered undergraduate institutions.  It's possible that there's been an increase in the representation of elite graduate institutions, especially law schools.  I may look at this issue in the future. 

Saturday, March 20, 2021

Bubbles, then and now

 A paper by Jacob Brown and Ryan Enos is getting a good deal of attention.  They find that there is partisan sorting even at the level of individual residences--that Democrats tend to have Democratic neighbors and Republicans tend to have Republican neighbors.  Although the study is cross-sectional, they imply that this tendency has been increasing, and this theme is even more prominent in the media coverage of their article.  National surveys are obviously not of much use in studying geographical sorting, but they may shed light on the more general issue of partisan sorting.  Just after the election, a Monmouth Poll asked "And thinking of your friends and family who voted this year, do you think most of them voted for Donald Trump or Joe Biden?"  Among people who voted for Trump, 89% said that most voted for Trump and 6% said that most voted for Biden; among people who voted for Biden, 80% said most of their friends and family voted for Biden and 8% said most voted for Trump.  That is, an overwhelming majority of people thought that most of their friends and family voted the same way they did.

The Gallup Poll asked similar questions in 1944, 1952, and 1956, specifically "what's your best guess about your friends, will most of them vote for Dewey this fall, or for Roosevelt" (in 1952 and 1956, they asked about voting Democratic or Republican).  I looked at the 1944 survey:  of the people who said they intended to vote for Dewey, 82% said most of their friends would vote for Dewey, 6% for Roosevelt, and 13% they they were evenly divided; among those who said they would vote for Roosevelt, 79% thought most would vote for Roosevelt, 8% that most would vote for Dewey, and 13% that they were evenly divided.  If we just look at the people who answered on one side or the other, the degree of "sorting" was very similar in both years:  people who thought their friends voted the same way they did outnumbered those who thought they voted the opposite way by a ratio of about 11 to 1.*  This is remarkable considering the difference between the elections:  1944 was probably a low point for partisan polarization in modern history, since news was dominated by the war and Dewey was a moderate who wasn't associated with the Republican Party's previous opposition to the New Deal.  

I looked for variation in the strength of "bubbles."  There was some, but in every group I looked at, even people who voted against the majority of the group thought that most of their friends voted the same way they did.  For example, about 70% of people who were classified as business executives or professionals said they intended to vote for Dewey, but 75% of the executives and professionals who voted for Roosevelt thought most of their friends would vote the same way, and only 14% thought that most would vote for Dewey.  

This illustrates a point that is often overlooked in discussion of "bubbles"--the importance of the bubble inside our heads.  Most people seem to think that most intelligent and fair-minded people will vote the same way they do, and that their friends are intelligent and fair-minded people, which leads to the conclusion that of course most of them agree with you.  Also, if you get a sense that a friend may not agree with you on politics, most people will steer clear of politics, while if you get a sense that a friend does agree with you, you'll be more likely to talk about it.  So my general feeling is that most people have always lived in pretty thick "bubbles," and that changes in sorting aren't the main factor behind increasing polarization.  

*The 2020 survey didn't report an "evenly divided" category--about 5% said they didn't know.  For the Gallup Poll, the figures I gave excluded "don't knows," who were about 17% of the sample.  You could say that the lower number of "don't knows" in 2020 indicates increased partisan sorting.  However, my impression is that the number of don't know responses was substantially higher in early surveys--people, at least the people who answer surveys, have become used to giving opinions on all sorts of things.  Also, my guess is that if people volunteered that their friends were about evenly divided, the interviewers on the Monmouth poll were instructed to encourage them to make a choice--"well, if you had to say...."  rather than count them as don't know.

[Data from the Roper Center for Public Opinion Research]

Saturday, March 13, 2021

Tolerance, part 6

 Last week Ross Douthat had a column about the Dr Seuss controversy.  He said that liberals used to have a strong aversion to the idea of banning books and an inclination to defend or even celebrate any book that was banned*, but that this has diminished or disappeared.  I have the same impression, but is there any systematic evidence?

Since the early 1970s, the General Social Survey has asked about whether certain kinds of people should have their books removed from "your public library":  somebody who is against churches and religion ("atheist" for short) , someone who advocates doing away with elections and letting the military run the country ("militarist"), a Communist, and a person who believes that blacks are genetically inferior ("racist").   In a future post, I'll look at liberal/conservative differences in opinions, but here I'll consider a related issue--the strength of association among opinions on the different cases.  That is, to what extent is there a tendency to say that they all should stay or all should go.   With four cases, there are six possible combinations.  I'll show them in groups of three--first, those among the communist, the militarist, and the atheist; and second, the correlations of those three with the racist.  

A definite downward trend for each, although maybe with a pause in the early 1990s.  


A similar pattern, but the magnitude of the decline is larger.  In the first years, the correlations involving the racist were similar to those involving the other items, but by the end they were all weaker.  So it seems like people are increasingly making distinctions, rather than having a general tendency to favor removing or not removing.  

In general, the association among different opinions ("attitude constraint") seemed to stay about the same from the 1970s to around 2000, and increased in the 21st century.   These questions followed a different course.  It doesn't seem that the high/low tolerance alignment is being replaced by a tendency to distinguish between the "left" and "right" pairs (atheist and Communist vs. militarist and racist)--just a general decline in the associations, especially those involving the racist.  

This doesn't directly address Douthat's issue, but it suggests that there has been a decline in support for the general "civil libertarian" position, even though there's been increasing support for civil liberties in most specific cases.


Note:  since these are yes/no questions, it would be better to use odds ratios rather than correlations, but I started with correlations and don't have time to re-do the analysis now.  

*Many "progressives" say that this case isn't really censorship because the decision was made by a private organization rather than the government, but that used to be an argument you heard from the right, not the left. 


Thursday, March 4, 2021

You could look it up, part 2a

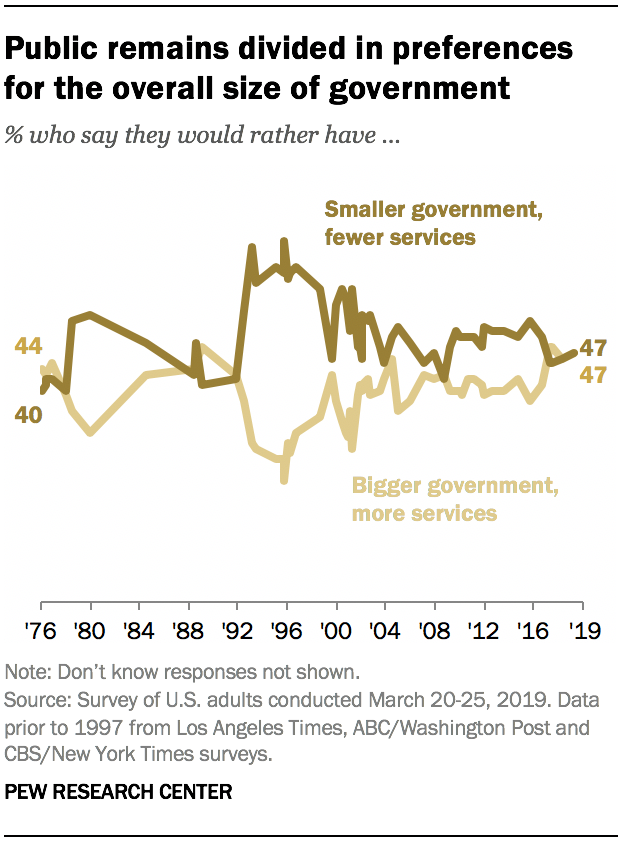
 After the death of Rush Limbaugh, Ross Douthat had a piece in which he said "The United States has moved dramatically leftward since the 1990s, on social issues especially but economic ones as well."  He's right about social issues, although the shift goes back farther than the 1990s.  For economic issues, he cites a survey question asked by various survey organizations about whether you'd prefer a bigger government providing more services or a smaller one providing fewer.  I reproduce the figure showing changes (from the Pew Research Center):

So opinion has moved left since the 1990s, but over the whole period, there is no trend.  Looking at the whole series, it looks like the 1990s were an unusually conservative time--apart from that, there hasn't been much variation.  This is similar to the pattern in several questions from the GSS, although the conservative movement in the 1990s is not as pronounced there.   Then there is the question about the government providing a job and good standard of living from the ANES that I wrote about recently.  The 1990s don't stand out in that one, but it's less useful for looking at short and medium term variation since it's taken only once every four years.  All of them agree in showing little or no trend since the 1970s.  So rather than a general liberal trend, I think there has been a liberal movement on many social issues but no real trend on economic issues. 

Friday, February 26, 2021

Gradually, then suddenly

 In 1974 and 1976, the Gallup Poll asked "More generally, how much trust and confidence do you have in the American people as a whole when it comes to making judgments under our democratic system about the issues facing our country--a great deal, a fair amount, not very much, or none at all?"  This question didn't appear again until 2001, but since then it's been asked fairly often, mostly by Gallup but also by the Monmouth University Polling Institute.  The averages, with higher values indicating more confidence:

It was lower in 2001 than in the 1970s, then rebounded for a few years, maybe as part of the general feeling of solidarity after 9/11 (the 2001 survey was taken just a few days before), then declined.  So there was definitely a downward trend.  But there was a sharper decline between 2010 and 2016, and then it stayed low before rebounding in the latest survey (Jan 21-24, 2021).  

A question about "trust and confidence in the wisdom of the American people"  showed a similar pattern of gradual decline and then sharper decline during the Obama administration.  This is different from the  decline in confidence in institutions, which has been pretty steady.


[Data from the Roper Center for Public Opinion Research]


Saturday, February 20, 2021

You could look it up, part 3

 My last couple of posts have argued that popular support for activist government didn't decline with the rise of the civil rights movement--if anything, it's somewhat higher today than it was in the 1950s.  So what is my explanation for what Heather McGhee called "the end of America’s high-tax, high-investment growth strategy"?  I don't have one, because it didn't happen.  Government spending and taxes as a percentage of GDP have grown since the 1960s (this is a convenient chart for spending and this is one for tax revenue). McGhee says that "tax revenue peaked as a percentage of the economy in 1969 compared with the average O.E.C.D. country," which may be true (although the NY Times story didn't include a link to the source for that either).  However, that's not because taxes have gone down in the US, but because they've gone up faster in other OECD nations.  

This piece illustrates a view that's popular on the American left--that the only reason that Americans don't support an extensive welfare state is racial animosity.  Although that's almost certainly a factor, it's not the whole story.  In 2012, I had a post comparing opinions about redistribution in thirty-eight nations.  New Zealand was least favorable, the US was third least, Britain was fourth, and Australia was sixth.  That is, it's not the United States that is distinctive, but Britain and nations that were settled from Britain.  (Canada wasn't included in the survey).  That is, there seems to be some lasting cultural difference in nations with a British heritage. 


Friday, February 19, 2021

You could look it up, part 2

 My last post was about a claim that white support for welfare state programs dropped sharply between 1960 and 1964, when the civil rights movement called for directing more of their benefits to black people.  I pointed out that there was a potentially important change in the question (from the ANES) between 1960 and 1964:

1956-1960: 
(Same introduction as in VCF0805 [CARD WITH RESPONSES SHOWN]).
'The government in Washington ought to see to it that everybody who
wants to work can find a job.'
1964,1968:
In general, some people feel that the government in Washington should
see to it that every person has a job and a good standard of living.
Others think the government should just let each person get ahead on his
own.'  Have you been interested enough in this to favor one side over
the other.  (IF YES:)  Do you think that the government --
To complicate things further, the ANES has run another question starting in 1972:
Some people feel that the government in Washington should see to it
that every person has a job and a good standard of living.  (1972-
1978,1996-LATER: Suppose these people are at one end of a scale, at
point 1).  Others think the government should just let each person get
ahead on his/their own. (1972-1978,1996: Suppose these people are at
the other end, at point 7.  And, of course, some other people have
opinions somewhere in between, at pints 2,3,4,5 or 6.)
Where would you place yourself on this scale, or haven't you thought
much about this?  (7-POINT SCALE SHOWN TO R)

A few other surveys have asked each of these questions over the years, so I tried to put them all together to get a sense of change over the whole time since 1956.  


I use the log of the odds ratios of support to opposition, since the percent of don't know/middle responses varied substantially.  For the seven point question, I counted 1-3 as support and 5-7 as opposition.  

It's clear that support is higher for the first form, which doesn't mention standard of living and also says "everyone who wants to work" rather than "every person."  With that form, support was higher in the 1970s than in 1956-70 or in 2012.  Since it's been asked only once since the 1970s, we can't be too confident about changes in that period, but it clearly didn't decline after the 1950s (the 2012 estimate is slightly higher than the 1956, 1958, and 1960 estimates).  

The second and third forms show about the same level of support (oddly, the ANES codebook treats 1 and 2 as variants of the same question, and 3 as a different question).  In order to see changes in the those variables more clearly, here's the figure omitting type 1:

Two of the results are from a NORC survey from early 1974.  It seems like that survey had an unusually liberal sample--I've looked at some other questions from it, and they all seem out of line with results from most contemporaneous surveys.  If you exclude those two, there might be an upward trend--towards more support for government responsibility.  If you include them, there's no evidence of a trend.   

So overall, there are two interpretations that are consistent with the data (1) support for government action increased from the 1950s to the 1970s, and then declined, so that there's no trend over the whole period, or (2) support for government action increased from the 1950s to the 1970s and then stayed about the same or increased slightly, so that it's now higher than in the 1950s.  The one possibility we can rule out is that popular support for government action has declined since the 1950s.  

That leaves the question of how I would explain "the draining of public resources and investments" since the 1950s.  I'll take that up in my next post.


[Data from the Roper Center for Public Opinion Research]