Thursday, October 27, 2022

No quarter, part 2

 In my last post, I discussed the idea that the combination of social liberalism and economic conservatism (or what is sometimes called "libertarianism") is an "empty quarter".   Of course, it's not literally true, but could the combination be underrepresented in some sense?  The figure below shows a hypothetical distribution of economic and social opinions.  I start by assuming a uniform distribution for both (which makes it easier to see the pattern in the picture), and then omitting everyone with an economic conservative/social liberal combination: 


The result is that the variance of opinions on social issues is larger among economic liberals than among economic conservatives, and the variance of opinions on economic issues is larger among social conservatives than among social liberals.  In my example from last time, I used abortion as the social issue.  The question had only two options, so the variance is just a function of the mean.  But the economic issue (redistribution) is on a scale of 1-7, so the variance is meaningful.  That is, the "empty quarter" hypothesis says that the variance in economic opinions will be larger for people who say that abortion should not be legal.  A comparison of standard deviations in three periods:

                           Legal      Not legal

1978-98             1.96           1.96
2000-2010         1.97           1.98
2012-2021         1.95           2.09

They are virtually the same in the first two periods, but there is some difference in recent years.  I tried a few more "social issues":  whether marijuana should be legal, whether sex between two adults of the same sex is morally wrong, whether there should be laws against the distribution of pornography to adults, and whether the Supreme Court had been wrong to rule against school prayer, using the same three periods for each.  In thirteen of the fifteen comparisons, the standard deviation of opinions on redistribution was larger among people who took the conservative position on the social issue.  The difference also seemed to become larger in the third period.  

I'm not sure that these results would hold up if you controlled for other potentially relevant factors (especially education).  I also haven't tried to translate the differences in standard deviation into an estimate of the degree to which the "libertarian" quarter is underrepresented, but I think that it's small.  Nevertheless, the results suggest there may be something to the "empty quarter" hypothesis, particularly in recent years.  Recent political history seems consistent with the idea that the economic conservative/social liberal combination is weakening.  Up until about ten years ago, quite a few people saw it as the wave of the future, but it seems to have faded in recent years, with some erstwhile libertarians shifting toward the "populist" right.  

If I had world enough and time, I would investigate this further, but I don't, so I'll just note it as a possibility.  


Friday, October 21, 2022

No quarter

 The other day, Paul Krugman proposed that Liz Truss failed because her program appealed to people who are to the right on economics and to the left on social issues:  "a barren quadrant where few voters may be found."  He refers to an analysis by Lee Drutman, which classified people into four groups:  45% to the left on both, 23% to the right on both, 29% to the left on economics and to the right on social issues, and only 4% to the right on economics and to the left on social issues.  Clearly the exact numbers will depend on the questions you use to measure the dimensions, and in an earlier post I objected to some of his choices, but didn't propose an alternative.  I'll start with a simple one in which the economic dimension is measured by a GSS question:

"Some people think that the government in Washington ought to reduce the income differences between the rich and the poor, perhaps by raising the taxes of wealthy families or by giving income assistance to the poor. Others think that the government should not concern itself with reducing this income difference between the rich and the poor. Here is a card with a scale from 1 to 7. Think of a score of 1 as meaning that the government ought to reduce the income differences between rich and poor, and a score of 7 meaning that the government should not concern itself with reducing income differences. What score between 1 and 7 comes closest to the way you feel?"

That's a pretty good summary of the basic difference between left and right on economic issues.   To make the tables simpler, I'll divide it into left (1-3), middle (4), and right (5-7).  There's no parallel question for social issues (and it's hard to imagine one), so I'll use a question on an important and long-standing issue: whether a woman should be able to get a legal abortion if "she wants it for any reason."  That's a yes/no question (I'll omit the small number of don't knows.  Over the whole period for which there is data (1978-2021), there is no association between opinions on these questions:  43% of economic liberals, 40% of economic moderates, and 42% of economic conservatives are in favor of legal abortion.    But in recent years, a positive association has appeared:


That means that there has been a change in the distribution among groups, even though overall opinions on both redistribution and abortion have been pretty stable

                  1978-2000     2002-2008      2010-2021

LL                 18%               21%               27%
LR                 29%               25%              23%
RL                 15%               14%               13%
RR                 19%               21%               21%

The  percentages don't add to 100--the rest are people who were exactly in the middle (4) on redistribution.  Although the LR and RL groups have declined, they still make up 36%, compared to 48% for "consistent" liberals and conservatives.

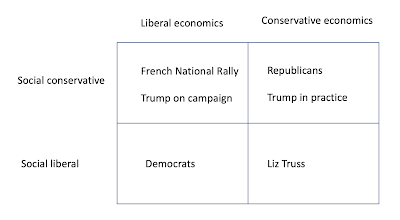
A few years ago, I had a post noting that there were a lot of people with RL or LR positions, but few politicians trying to represent them.   Krugman offers this diagram:


In his analysis, the conservative economics/social liberal combination is rare, so there are only three substantial groups among the public, and they all have representation.  However, as I've noted several times, there's no evidence that ordinary voters saw Trump as liberal on economic issues.  The characterization of the National Rally is also questionable.  So the puzzle is still there.

PS:  Although I wasn't following closely, I don't think that Truss's problem was that her policies were inherently unpopular--what hurt her was the reaction of the financial markets.  Also, it's a parliamentary system, so a party can easily drop a leader when they become a liability, and it sounds like she started with relatively weak support among Conservative MPs.   


Monday, October 17, 2022

Law and public opinion, part 1

Starting in 1987, a number of surveys have asked "When the Supreme Court decides an important constitutional case, should it only consider the legal issues, or should it also consider what the majority of the public thinks about that subject?"  I was interested in seeing if there were any consistent partisan or ideological differences on this question, but got diverted when I did a cross-tabulation with education:


                                           Legal        Depends (vol.)      Public Opinion
No HS diploma                    32%               4%                     64%
HS                                        42%               4%                     54%
Some College                       57%                4%                    40%
BA                                        64%               5%                     31%
Grad educ                             76%               5%                     19%

This is a strong relationship, by the standards of public opinion data--about as strong as the relationship with a question about how much attention you had been paying to the confirmation hearings for John Roberts, which were going on at the time.   A little more investigation showed that age was also a strong predictor, although not as strong as education--older people were more likely to say that the court should only consider the legal issues.  So far, I have only analyzed one survey, so this could be either a cohort or an age effect. Gender and race also seemed to make some difference (women and blacks are more likely to say that it should consider public opinion), but there's no evidence that religion mattered.  

Over time, there seems to have been some movement towards saying that the court should just consider the legal issues:

                      Legal        Public Opinion
9/1987            32%             60%
7/2005            48%             46%
3/2013            46%             45%
5/2013            47%             45%
6/2015            52%             40%

However, the 1987 survey was taken during the Robert Bork confirmation hearings, so the results for that survey may represent a reaction against him--unlike subsequent nominees, he made it clear that his legal interpretations would lead him in unpopular directions.  


 [Data from the Roper Center for Public Opinion Research]

Monday, October 10, 2022

Self-deception

 A few weeks ago, Ross Douthat asked "How does a party that historically represented the rich and big business adapt to a world where conservatism’s constituencies are not just middle class but blue-collar, downscale and disappointed with the modern American economy?"  My answer is in the title to this post.  In late 2020 I wrote about a question that had been asked a number of times between 1987 and 1996 and then again in October 2017:   "in general, do you think that the [Democratic/Republican] Party favors the rich, favors the middle class, favors the poor, or does it treat them all the same."  I compared a couple of surveys from the first period to the 2017 survey, and noted that the perceptions of (self-described) Republicans had changed:  in the 1980s and 1990s, about 30% said that the Republican party favored the rich; in 2017, that had fallen to 12%.  At the same time, the percent of Republicans who said that the Democrats favored the rich went from 18% in 1987 to 24% in 1996 to 34% in 2017.  This post will look at the same data from another angle.

The 1996 survey had a question about vote in a hypothetical race involving Dole vs. Clinton (omitting Perot) and the 2017 survey had a question about vote in the 2016 election.  I regressed this on dummy variables representing perceptions of the parties:  Republicans favor the rich, the middle class, and the poor, and Democrats favor the rich, the middle class, and the poor ("treat them all the same" is reference category for both).  The estimates, predicting the chance of Republican support:

                            1996               2017

R Rich                  -2.2               -3.7

R Middle              -0.3               -0.0

D Rich                    1.8                2.0

D Middle                0.2                0.0

D Poor                    2.0                1.9

Same                       0.7                0.6

The standard errors are all around 0.3 in 1996, and about 0.3 to 0.5 in 2017.  I omit the estimates for people who thought the Republicans favored the poor--very few people believed that, so the standard errors were very large.  "Same" is people who gave the same rating to both parties (e. g., said that both favored the rich).  They were somewhat more likely to favor the Republican candidate, which could be the result of a Republican advantage on perceptions of competence or non-economic issues.  

At both times, being seen as favoring the rich (as opposed to the middle class or poor) hurt both parties, and being seen as favoring the poor hurt the Democrats.  All of the estimates were about the same at both times except for Republicans favoring the rich, which was almost twice as big in 2017:  that is, a perception that the Republicans favored the rich was more damaging in 2017.  

Of course, the relationship could go in either direction:  people could form perceptions of the parties and use them in deciding how to vote, or people could decide who to vote for and adjust perceptions to support their decision.  It seems safe to say that both are involved, but my guess is that the second one is more important.  That is, there's been a change in the way that Republican voters rationalize their decision:  they are increasingly unwilling to see their party as favoring the rich.  Several years ago, I proposed that there had been a growth of social egalitarianism, and that at one time "Republicans thought of themselves as the party of successful people.  Now both parties think of themselves as the party of the common people, plus the fraction of the elites who care about or understand the common people."  I think these results support that analysis.

Returning to Douthat's question, why haven't Republicans responded to the changes in party support by shifting their policies?  One reason is ideology--both in the positive sense of an attachment to tax and spending cuts and the negative sense of a dislike for anything associated with "the left."    Another is that "downscale" (less educated) voters are shifting towards the Republicans anyway.  This has been going on for a long period of time, and doesn't seem to be closely connected to changes in party policy.  So rather than making changes in policy, party leaders can congratulate themselves on being "the party of the working class" (and on being unpopular among "elites") while following the same policies as before.  

PS: here is the trend on beliefs about favoring the rich in the whole sample (Democrats, independents, and Republicans):


There's no clear change for Republicans, and some evidence of an increase for the Democrats (the Pearson correlation with time is .73, and the Spearman correlation is .65).  

[Data from the Roper Center for Public Opinion Research]

Tuesday, October 4, 2022

Lost in translation

 A few days ago, the New York Times had an opinion piece by Huw Green, a clinical psychologist, which said "A clear causal link between psychiatric illness and gun violence has not been established..."   I followed the link, which was an interview with Ragy Girgis, a professsor of psychiatry at Columbia University.  That story had a caption saying "Findings from the Columbia database help dispel the myth that having a severe psychiatric illness is predictive of who will perpetrate mass murder."  It also contained a link to an article by Dr Girgis and others using the database (an attempt to compile a comprehensive list of mass murders since 1900), which said "the prevalence of psychotic symptoms among mass murderers is much higher than that in the general population (11% v. approximately 0.3-1%)."   That is, people with psychotic symptoms were between 10 and 30 times more likely to commit mass murder than people without psychotic symptoms.  

How did we go from 10 to 30 times more likely to "dispel the myth"?  The interviewer asked "Are people with mental health disorders more likely to commit mass shootings or mass murder?"  The answer started "The public tends to link serious mental illnesses, like schizophrenia or psychotic disorders, with violence and mass shootings. But serious mental illness—specifically psychosis—is not a key factor in most mass shootings or other types of mass murder.."  That is, it didn't answer the question that had been asked, but a different question:  whether most mass murders are committed by people with severe mental health disorders.   The answer to this second question is no, according to the information in the database.  But the answer to the question that the interviewer had asked was yes (at least for one kind of mental disorder, psychosis).  Apparently the interviewer didn't notice the difference, and followed up by asking "why does the public erroneously link mental illness with mass shootings and with violence in general?"

This could just be a case of miscommunication--anything involving probabilities can be confusing.  However, I think it's an example of a more general problem:  sometimes a focus on making sure that people don't draw the wrong conclusions comes at the expense of explaining what the research actually found.  I first noted this when writing  a post on a study of coffee consumption, where accounts emphasized a point that wasn't supported by the data:  that benefits only occurred with moderate consumption, not high consumption.  I saw another example later in the summer, when a study of diet and exercise was described as showing "that healthy eating and regular workouts do not, in isolation, stave off later health issues. They need to be done together."  In fact, the study suggested exactly the opposite--exercise and diet had additive effects on mortality, and no interactions were found.  The reason seemed to be a goal of getting people to think of exercise as a way to improve one's overall health rather than a way of getting away with a bad diet--"the study highlights the importance of viewing food and exercise as components of holistic health, Dr. Ding said, instead of calculating how many miles can 'cancel out' a cookie."  With mass shootings, there's concern about increasing the stigma against mental illness. As these examples suggest, the problem is more prevalent in medicine and public health, where researchers know that people might use their findings to make decisions.   

Friday, September 30, 2022

The other popular vote

Some observers say that the Republicans remain competitive only because they benefit from features of the American political system such as the Electoral College, equal representation of states in the Senate, and gerrymandering.   For example, this article in the New York Times notes the Democrats have won the popular vote in seven out of the last eight presidential elections and calls it "an unprecedented run of popular-vote success in U.S. history."   However, that's just presidential elections--during the same period, the Republicans have had majorities in the House of Representatives more than two-thirds of the time.  Is because Republicans have done well among voters or because of gerrymandering or clustering of Democratic voters in urban areas?  Nationwide vote totals for congressional elections are not routinely reported, but figures for 1946-2018 can be found in a report by the Brookings Institution

 It turns out that the Democratic share of seats in the House has exceeded their share of the votes in House races in 22 of the 37 congressional elections, but the advantage has shifted.  The figure shows share of seats vs. share of votes in two periods:


1946-1992 elections are in blue, 1994-2018 are in red.  The diagonal line is y=x, that is, share of the seats matches share of the vote.  Most of the points in the first period are above the line, meaning that the Democrats did better in seats than in votes, and most of those in the second period are below.  The Democratic advantage in seats in the first period may have been a result of the "solid South," which involved almost complete suppression of the black vote and low turnout among whites.  That is, the Democrats won a lot of Southern seats with low numbers of votes (even though they had high shares of the vote).  The current Democratic disadvantage probably reflects a tendency for votes to be "wasted" in non-competitive urban districts.  But whatever the reason, Democrats now are usually at a disadvantage in turning votes into House seats.  

The other thing to notice is the red vertical line, which marks equal vote shares.  In the first period, the points are almost all to the right of the line:  that is, Democrats got more votes.  Since 1994, this has changed--Republicans have gotten more votes in most elections.  The next figure shows the ratio of Democratic to Republican votes over time:

The Democratic share generally increased until the mid-1970s, then declined, before levelling off around 2000.  Although the swings in presidential vote shares from one election to the next have been small in the 21st century, swings in vote shares for the House of Representative have been fairly large--the 2010 swing was the largest since 1948.

I don't have any particular conclusion from all this--I just think it's data that deserves more attention.  


Sunday, September 25, 2022

Self-interest, economics, and partisanship

 My last post didn't include any data.  That's because it involves a general framework for interpreting events rather than a specific proposition.  However, when looking at potentially relevant data I found an interesting pattern.  Since the 1970s, the GSS has included the question "Do you consider the amount of federal income tax which you have to pay as too high, about right, or too low?"  About 60% say that it's too high and hardly anyone (about 1%) says that it's too low.  You could say that this shows the importance of self-interest:  .  However, opinions on this issue didn't have much connection to partisanship or other political opinions.    The figure shows the average opinions about tax by party and income groups (the first three are roughly quartiles, and the fourth and fifth are roughly eighths.  There's no connection to partisanship except maybe in the highest income group.  


But that figure only includes data up to 2006.  The relationship has changed, and although I haven't examined it systematically, the change seems to have happened pretty quickly.  


Since 2008, Republicans have been more likely to say that they pay too much tax, and the gap grows with income.  High-income Republicans are the most likely to think that they pay too much (71% say too much, 0.2% say too little).  High income Democrats are the least likely:  37% too much, 10% too little (up from less than 3% in 1976-2006).  So this is an economic issue that has grown in importance.  Another interesting point:  that the averages are lower (more people say that they pay too little or about right) in 2008-21.   So you could say that there's been a move away from self-interest, but not away from economic issues--that people's ideas about fairness make more difference than they used to.  Of course, it's not definitive evidence of anything, but it's consistent with my interpretation from last time.