Thursday, July 28, 2022

More on the Supreme Court

  A comment on my last post noted that the Harris Poll question saying the Supreme Court had decided "that the police could not question a criminal unless he had a lawyer with him" was a mischaracterization--the decision just said that the police had to inform suspects of their right to have a lawyer present--and suggested that support might have been higher if the description had been accurate (saying "suspect" rather than "criminal" might also have made a difference).  Shortly after the decision, the Gallup Poll asked "have you heard or read about the recent US Supreme Court decision about confessions by persons charged with a crime."  If the respondent said yes, they asked "do you think the Supreme Court's ruling is good or bad?"  Combining the two questions, the results were:

Hadn't heard:  58%

Good:              10%

Bad:                 19%

Not sure:          13%

The comparison with the Harris Poll (which found that 30% approved, 56% disapproved, and 14% weren't sure) illustrates some general issues with interpreting surveys.  You could argue that the Gallup results show that most people didn't really have an opinion on the Miranda decision--that most people who said they approved or disapproved in the Harris Poll were just giving an off-the-cuff response to the (inaccurate) description.  On the other hand, you could say that there may also have been people who had heard about it but forgotten, and just needed a hint to jog their memory.   Despite the differences, both surveys showed about the same ratio of negative to positive evaluations (almost 2:1):  that is, they both suggested a widespread perception that the court was "soft on crime."  You could imagine other questions that would tell you something about whether that perception could be changed--for example, what if you used a different description of the decision, or gave some background information, or asked people who said that they had heard of the decision what they thought that it said.  One of the reasons that candidates commission their own surveys is to investigate things like that.  The general point is that there's no definitive question that tells you what people "really think," and when you have several questions on a topic, you don't have to pick one as the best--they can all shed some light.   

My recent posts on the Supreme Court got me wondering about how perceptions of the court have changed.  Starting in 1986, a number of surveys, mostly by Gallup, have asked "do you think the Supreme Court has been too liberal, too conservative, or just about right" (with some minor variations in the introduction).  The figures gives the percent saying too liberal minus the percent saying too conservative:


The different colors indicate Democratic and Republican presidents.  There is a clear pattern in which people perceive the Court as too liberal when a Democrat is president and too conservative when a Republican is.  This "thermostatic" reaction has been noted for other issues, but it's surprising that it appears for the Supreme Court.  The last observation (September 2021) is an exception--despite a Democratic president, the perception of the court as conservative is even stronger than it was under Trump.  The absence of a general trend is also interesting--most informed observers would say that the court has been getting more conservative over the period.


The percent who saw the court as "too liberal" or "too conservative" shows a different pattern--a pretty steady increase, without much difference between Democratic and Republican administrations.  There isn't much change in the percent saying "about right," but the percent of "don't knows" has declined pretty steadily, from 15-20 percent in the 1980s to around 3 percent today.  This change presumably reflects a combination of rising partisan polarization and increased attention to the Supreme Court.

[Data from the Roper Center for Public Opinion Research]


Thursday, July 21, 2022

One thing led to another

 This post started as a postscript to my previous one, on public opinion about the Supreme Court in the 1960s.  I gave figures from a 1966 Harris poll on opinions of six decisions, but they were based on people who had an opinion.   I thought there might be substantial numbers of "don't knows" for some of them, so I looked for the original data, which can be found in the Odum Institute data archive at the University of North Carolina.  So here they are:

"In 1954, the US Supreme Court ruled that it was illegal to require Negro children to go to all-Negro or segregated schools.  Do you personally think that decision of the US Supreme Court was right or wrong?"  right 57%; wrong 32%; DK 11%.

The others were all of the form "Another decision of the US Supreme Court was to ____.  Do you personally ...".  Just giving the key text:

"rule that the State Department could not refuse to allow Communists from travelling abroad"  36%-39%-25%

"rule all Congressional Districts had to have an equal number of people in them so each person's vote would count equally"  56%-24%-20%

"rule that children could not be required to recite a prayer in school" 27%-65%-8%

"rule that the police could not question a criminal unless he had a lawyer with him" 30%-56%-14%

"rule that any refusal by a hotel, motel, or restaurant to serve a person because of their race was illegal" 56%-34%-20%

The survey also asked "all in all, how would you rate the job the US Supreme Court has done over the last 10 to 15 years--excellent, pretty good, only fair, or poor?"  Among those who had an opinion, 8% said excellent, 38% pretty good, 32% only fair, and 22% poor.  

My last post suggested that changes in approval of the Supreme Court might have reflected changes in the importance that people placed on different issues--in  particular, increased focus on crime, an area where the court's decisions were unpopular.  Since the data had an overall rating and measures of the approval of some specific decisions, I decided to use it to investigate this point.  Although it couldn't shed light on change, it could tell us something about how much the different decisions mattered to people.  I did this by regressing ratings on views of the decisions (counting don't know about a decision as an intermediate position).  I did this separately for college graduates and other people, because I suspected that there would be some difference between the groups.  The figure shows regression coefficients for the two groups (actually, the regression coefficients multiplied by 10).


The line represents equal values in the two groups--points above the line mean a decision counted more among college graduates.  Most points were above the line--this is what I expected, because opinions are usually more closely connected to each other among educated people.  The least popular decision--school prayer--was the least important among both college graduates and other people.  The relative importance was similar in both groups, with one major exception--the Miranda decision (right to a lawyer) was the most important among less educated people but only fifth among college graduates.  That decision was unusual in another way--there was little difference between approval among college graduates and less educated people.  On all the others, college graduates were substantially more likely to approve.  

In a previous post, I mentioned that a question in 1994 found overwhelming approval (88%) of the decision on segregated schools.  A survey in 2000 asked  about "the recent decision upholding 'Miranda Rules' requiring police to inform arrested suspects of their rights to remain silent and to have a lawyer present during any questioning? Do you generally agree or disagree with this decision?" and found that 86% approved and only 11% disapproved.   I think that there would also be overwhelming approval of the non-discrimination, equal population in districts, and school prayer decisions (school prayer still is controversial, but the decision referred to in 1966 involved public school teachers leading students in prayer during classroom hours).  Some of this change reflects a widespread liberal trend in opinions on "social issues".  But with the Miranda decision, I think that another factor was that it led to a standard procedure--police gave a "Miranda warning"--which made it easier for people to get used to it.  In contrast, the abortion ruling has led to confusion, as some states have new laws that don't make clear exceptions for cases in which there's overwhelming popular support for legal abortion, like the 10-year old rape victim in Ohio, some have conflicts between local and state governments, and some have controversies about reviving laws that were in force before Roe v. Wade.  So my prediction is that support for legal abortion will grow in the next few years.


Friday, July 15, 2022

The Supreme Court in the 1960s

In my last post, I discussed predictions that the Supreme Court would lose legitimacy because of public disapproval of the decision overturning Roe v. Wade.  I noted that ratings of the Supreme Court were favorable in 1963 and 1967, but then fell sharply from June 1967 to July 1968.  What might have caused this change?  I searched for contemporary survey questions about Supreme Court decisions.  In November 1966, the Harris Poll asked a series of questions--I give the percent approving, among those who had an opinion*:

School desegregation                                     64%

Equal numbers in Congressional districts:    76%

No right to refuse service because of race:    64%

Can't stop Communists from foreign travel:  49%

Right to attorney in police questioning:         35%

school prayer                                                  30%

In all of these cases, the court had ruled in what was considered a liberal direction.  Some of the rulings were popular with the public and others were unpopular.  

There were no questions about Supreme Court rulings between June 1967 and 1968.  Thurgood Marshall had been nominated just a few days before the 1967 survey, and the confirmation hearings took place in the following months.  There were no national survey questions about views of the Marshall nomination, but one from the Minnesota Poll found overwhelming approval in that state.  My guess is that it didn't make much difference--the people who disapproved of him who already had a negative view of the court because of civil rights ruling.  

So maybe the change wasn't because of what the Supreme Court did over that period, but because of other things in the world.  1967 was the "long hot summer" of urban riots--most of them, including the ones in Detroit and Newark, took place after the 1967 survey.  There were more riots after the assassination of Martin Luther King in April 1968.  In July 1968, another Harris Poll asked people if they agreed or disagreed with several statements about the Supreme Court.  For "The present court has been good in the desegregation and one man-one vote decisions,"  41% agreed, 25% disagreed, and 34% weren't sure.  For "The present court made it harder to convict criminals and was wrong to ban prayers from schoolrooms," 78% agreed, 11% disagreed, and 11% weren't sure.  So the events of 1967-68 may have increased the salience of issues about crime, on which most people disapproved of the court decisions.  In June 1968, Gallup asked about whether people would like new members of the Supreme Court to have liberal or conservative views:  51% said conservative and 30% said liberal, although the number of self-described liberals and conservatives was about equal at that time.  As I mentioned last time, views of the Supreme Court eventually recovered--that was partly because the Court became more conservative, and partly because the public came to accept some decisions that had initially been unpopular (most aspects of the Miranda ruling).

*I would have liked to include don't knows, but they weren't given in the source.  

[Data from the Roper Center for Public Opinion Research]

PS:  here's a short piece I wrote with Andrew Gelman that was published earlier this week: https://www.smerconish.com/exclusive-content/how-abortion-became-one-of-the-most-polarizing-issues-in-america


Tuesday, July 5, 2022

Losing legitimacy?

 Since the Dobbs decision, I have seen many claims that it has (or will) cause the Supreme Court to lose legitimacy (here is one example).  It does appear that most people did not want the court to overturn Roe v. Wade, but this is not the first unpopular decision (and almost certainly not the most unpopular).  That raises the question of why this particular decision should have a lasting effect.  It seems like a reasonable model to start with would be that decisions affect views of the court based on a combination of popularity and prominence, but that the impact declines over time as memories fade and people get used to the new situation (which is almost never as bad as critics of the decision predicted it would be).  On the other hand, there may be some decisions that have a lasting impact, maybe because they have unexpected consequences that keep them in the news (for example, if state differences in laws on abortion lead to disputes between states that produce more cases for the Court) or just because they seem so unfair to a substantial part of the public (the case that decided the 2000 election might be an example).  

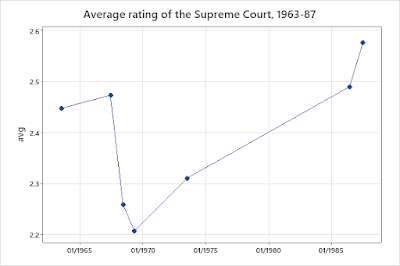
According to the Gallup Poll, confidence in the Supreme Court has generally declined since the 1970s--see this post and the latest update from Gallup.  But there has been a decline in confidence in many institutions, so it's hard to say what part of that is unique to the Supreme Court.  So I looked for data going farther back, and found one from Gallup that was asked six times from 1963 to 1987:  "In general, what kind of a rating would you give the Supreme Court:  excellent, good, fair, or poor."  You could say that "confidence" gets at something deeper than "rating," but I think that most people don't  make much distinction, so that they are reasonably good substitutes.  What makes this question useful, aside from the general benefit of extending the period for which data are available, is that there were a lot of important decisions in the 1960s.


The average rating was lower in the middle (1968, 1969, and 1973) and then bounced back.  An interesting point is that there was less dispersion in 1986 and 1987 than there had been in 1963 and 1967--fewer "excellents" and fewer "poors".  There was a sharp decline in average confidence  between June 1967 and June 1968.  In my next post, I will try to find evidence, or at least hints, about what might have caused that.

[Data from the Roper Center for Public Opinion Research]


Sunday, June 26, 2022

Misinformation


In 1946, a Roper/Fortune survey asked "Here are three different kinds of job:
A job which pays quite a low income, but which you were sure of keeping.
A job which pays a good income but which you have a 50-50 chance of losing.
A job which pays an extremely high income if you make the grade but in which you lose almost everything if you don't make it.
If you had your choice, which would you pick?"

Back in 2013, I had a post on this question, which noted that it was asked again in 1957 and said "unfortunately, the question has never been asked again."  That was wrong--it's been asked twice since then, as well as once in 1948 (maybe I should say "at least," in case I'm still missing some).  The results:

           Safe        50/50      Risky

1946      56%       21%        18%

1948      47%        32%        19%

1957       42%        26%        26%

1962       48%         33%        14%

1981        22%        34%         36%

There is a move towards more risk/more reward, with the exception of 1962.  I'm not sure if that reflects a short-term change or some other difference--the 1962 survey one was done by Gallup while the others were all by the Roper organization.  There was also a difference between 1981 and all previous surveys--the earlier ones had asked men and single women about their job, and asked married women about their husband's job--that is, what you would like him to have.  In 1981, they asked all employed people about their own job (and didn't ask people who weren't employed).  But there was still a change after adjusting for this difference:  "in 1957, men were almost evenly divided among the three options, while almost 50% of women chose the safe job and only about 20% chose the high income/high risk job."  In 1981, only 19% of men chose the safe job and 45% chose the risky one, while women were pretty evenly divided (29%/39%/32%).  

I wondered if opinions on this question were related to political views--that is, people who thought that they could "make the grade" would be more conservative.  The 1981 survey didn't have many political questions, but it did have one about whether you would describe yourself as a supporter or critic of President Reagan.  There was a relationship--people who favored riskier choices were more likely to be supporters, but it became considerably smaller and no longer statistically significant after adding a few controls.  One important control variable was race--black people were more likely to favor the safe job and less likely to support Reagan.  Another was education--more educated people were considerably more likely to favor the risky job, and more likely to support Reagan--here is support for Reagan by education among whites:

not HS grad      62%

HS grad            70% 

some college    75%

bachelor's         80%

graduate           71%


I was a bit surprised by that, even thought I knew that at one time education was associated with support for the Republicans and have written about that in this blog.  I felt like 1981 was part of the "modern" period of political alignments--I don't think that I would have been surprised to see that pattern just a few years before.  I guess the lesson is that thinking in terms of categories or eras has a strong appeal, even when you know that the changes were gradual.  

[Data from the Roper Center for Public Opinion Research]

Sunday, June 19, 2022

Too bad to be true

 Michelle Goldberg had a column arguing that there has recently been a turn against feminism.  One piece of evidence is a poll sponsored by the Southern Poverty Law Center.  According to this poll, support for feminism was considerably lower among younger Democrats than among older Democrats.  In Goldberg's summary:

"Predictably, most young Republicans agree with the statement, 'Feminism has done more harm than good.' What was astonishing was how many young Democrats agreed as well. While only 4 percent of Democratic men over 50 thought feminism was harmful, 46 percent of Democratic men under 50 did. Nearly a quarter of Democratic women under 50 agreed, compared with only 10 percent of those 50 and older."  

Here are the figures for all age/party/gender groups.

                 DM             RM                  DW              RW

18-49   41%-46%     31%-62%       71%-23%      34%-52% 

50+      94%-4%       52%-42%       87%-10%      32%-51%

change   -48%              -21%               -15%             +2%

I show the pro-feminist position (disagree) first.  The last row is the change in support for feminism from older to younger, defined as the average of changes in disagree and agree.  For example, among Democratic men, disagree fell by 53 and agree increased by 42, and (53+42)/2 rounds to 48.  So the survey showed a huge drop in support for feminism among Democratic men, substantial drops among Republican men and Democratic women, and essentially no change among Republican women.  

You rarely see numbers like 4% on agree/disagree questions, even among partisans.  For example, in 2012, Gallup asked if "there should or should not be a law that would ban the possessions of handguns, except by police and other authorized persons."  This is an issue that's divided the parties for a long time, and it's hard to imagine a Republican politician supporting it--but 11% of people who identified as Republicans did.  Also, the gap between younger and older Democratic men is implausibly large.  The two groups are just arbitrary divisions in a continuous variable--that is, you're not comparing "young" and "old," but mixed groups that both include a lot of middle-aged people.   

The best match to the SPLC question I could find was in a 2020 Pew survey, which asked "overall, what impact, if any, has feminism had on the lives of" various groups.  The groups included black women, white women, and Hispanic women.  First, I counted "helped" as +1, "hurt" as -1, and "made no difference" as 0.  Then I summed the scores, and counted +3 (helped all groups) as equivalent to disagreeing with the "more harm than good" position, negative scores (hurt more groups than it helped) as agreeing, and scores of 0-2 as mixed.  

The figures for the age/party/gender groups:

                   DM               RM                  DW              RW

18-49      58%-13%      40%-24%       51%-16%      46%-15% 

50+         60%-14%      43%-21%       53%-11%      42%-15%

change       -1%               -3%                  -4%               +2%

They show little generational difference among any group.  Also, although Democrats are more favorable, the partisan differences are smaller than in the SPLC poll.  This seems reasonable to me, since "feminism" can be interpreted in many different ways.  

The SPLC poll shows similarly implausible results on some other questions--for example, only 2% of Democratic men over 50, but 42% of Democratic men aged 18-49 agree that "transgender people are a threat to children."  They didn't give details on their methodology--just said it was from an online panel of 1,500 people--so it's hard to guess what went wrong.  Maybe it was something strange with the weights, so that the group figures are dominated by a few people.  However, that would be more likely to occur in small groups, such as black Republicans, and all of the age/gender/party groups would be expected to be fairly large.  But in any case, the SPLC survey can't be taken seriously.


[Data from the Roper Center for Public Opinion Research]

Tuesday, June 7, 2022

There's No U

 The New York Times had a story about the health effects of coffee, based on a paper in the Annals of Internal Medicine. The study found that coffee drinkers had substantially lower mortality rates compared to people who didn't drink coffee, even after adjusting for a large number of variables involving health, diet, and exercise.  The point that caught my attention was that the story emphasized that the results involved moderate coffee consumption, and concluded with a warning: 

 "The study showed that the benefits of coffee tapered off for people who drank more than 4.5 cups of coffee each day.  Past studies have shown that consuming 'extreme amounts' — over seven cups per day — can take a toll, she [Christina Wee, professor at Harvard medical school and deputy editor of the Annals] said.

'Moderation is good,' Dr. Goldberg [professor at NYU medical school] said. 'But too much of a good thing isn’t necessarily more of a good thing.'"  

I like coffee, and probably fall into the "extreme amounts" group, so I wanted to see how strong the evidence was.  

The estimated relationship between coffee consumption and mortality rates is shown in this figure from the paper:


The first column is people who drink unsweetened coffee, the second people who drink coffee with sugar, and the third is people who drink it with artificial sweetener--all are compared to people who didn't drink coffee.  For unsweetened coffee, it looks like the reduction in mortality is about the same for all of the range of 3-8 cups, and for coffee with artificial sweeteners, it gets larger the more you drink.   It's only for coffee with sugar that there's evidence that high amounts are worse than moderate amounts.  The confidence intervals are pretty wide in all cases, so they don't rule out the possibility that the reduction in mortality gets smaller with larger amounts of unsweetened coffee, but they don't support it either.   It seemed strange that the Times story emphasized a point that wasn't really supported by the analysis, but on reading the article more closely, I can see why it did.  It was just following the paper, which mentioned a "U-shaped association with mortality" several times.  Moreover, the paper was accompanied by an editorial (written by Dr Wee) which said "they found a U-shaped association."  

The main focus of the paper wasn't the shape of the relationship, but whether there was a difference between sweetened and unsweetened coffee--specifically, whether the (apparent) benefits were smaller for sweetened coffee.  In fact, the sample wasn't very useful for estimating the shape, because there weren't many people who drank large amounts.  The paper didn't describe the distribution in detail, but the mean number of cups per day for those who drank coffee was 2.4, with a standard deviation of 1.3, so 7 cups would be about 3.5 standard deviations above the mean.*  

So why did the paper and the editorial emphasize a secondary point and mischaracterize it?  I think it's a combination of two things:  

1.  Traditionally people modeled non-linear relationships using polynomial regressions, starting (and often ending) by adding x squared.  A regression with x and x-squared will always be symmetrical around the minimum/maximum.  So people got into the habit of  thinking in terms of U or inverted U shapes, and that has persisted even after more flexible methods of modelling non-linear relationships have come into use.  

2.  Medical people are inclined to start from the assumption that extreme consumption of anything is bad.

2a.  When communicating with the public, they are not purely concerned with conveying information, but also with getting people to do the right thing, or not encouraging them to do the wrong thing.  Since some people tend to excess, emphasizing moderation is part of that.


*The data were from Britain.