Thursday, May 20, 2021

A feature, not a bug

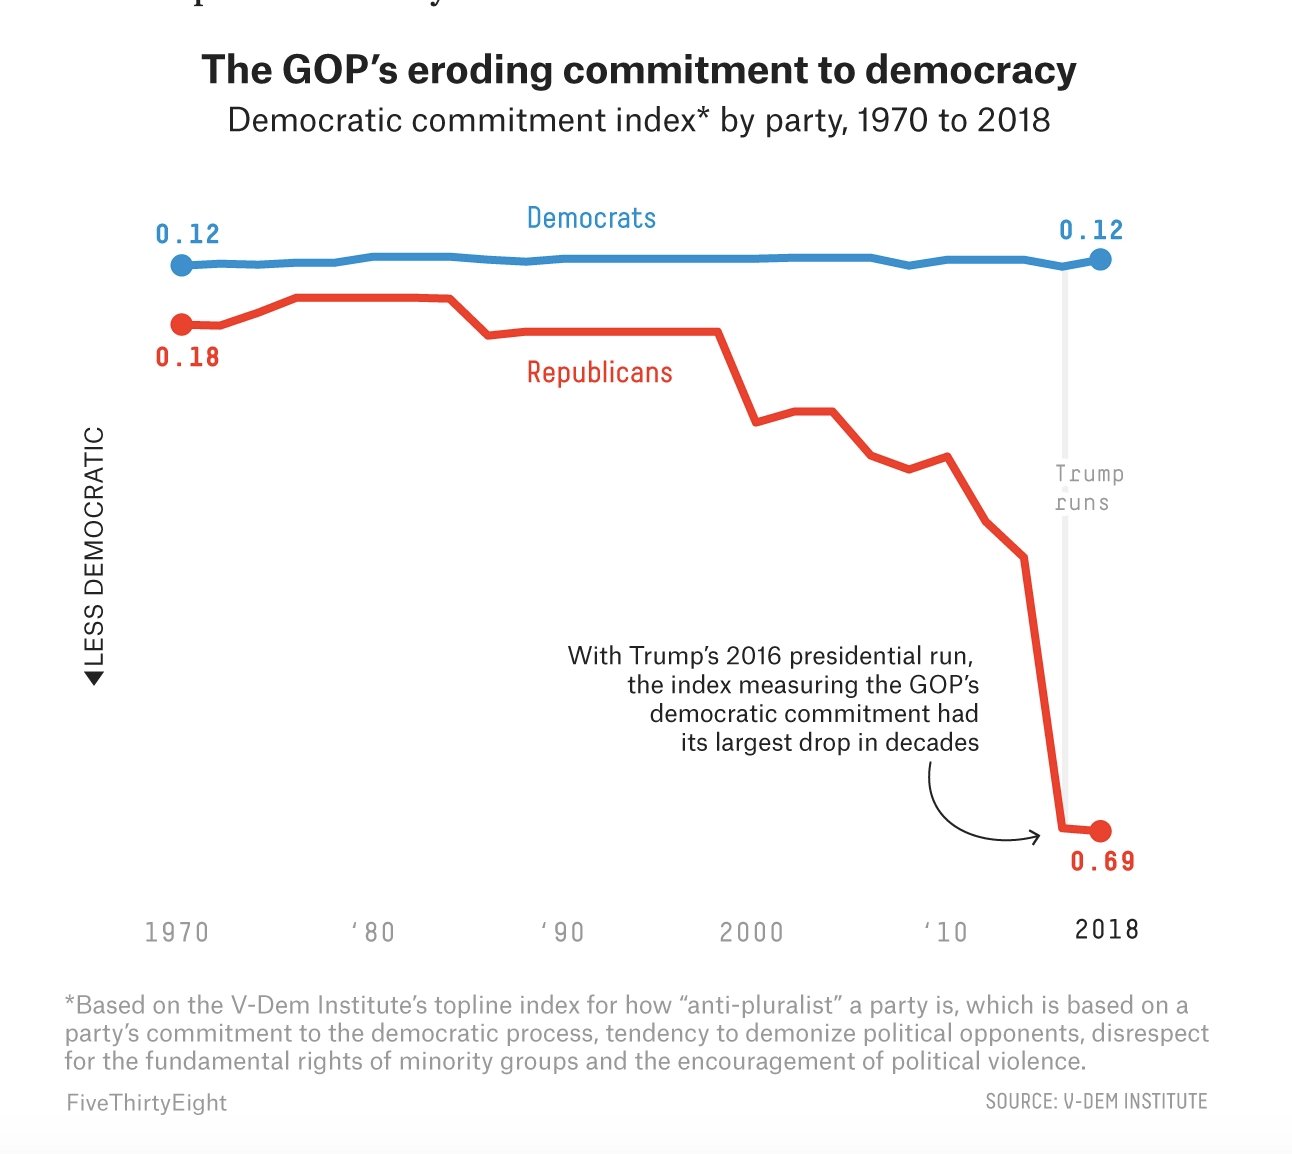
 Ross Douthat had a tweet about this figure from a 538.com article, which was based on data from the Varieties of Democracy project:  
Image 

 His comment was "It's the totally-flat blue line that tells you this chart is super-serious."  He was being sarcastic, but ironically he was right:  it is the flat blue line that tells you it is a serious measure of what it purports to measure.  In an established democracy, normally all of the major parties accept the rules of the game:  they don't try to block their opponents from running or interfere with the counting of votes; if they lose, they leave office, and if they win they don't try to put their opponents in jail or change the rules to make it harder for them to compete.  The result is lines with values near zero and very little variation over time (V-Dem calls it an "illiberalism index" although the 538 figure reversed it so that high numbers mean acceptance of liberal democracy).  

As an example, here are values for Australia:


The two slightly higher values are for short-lived minor parties--all of the major parties, left, right, and center, have values like .05, with hardly any variation.

Or Germany:


All low except for the right-wing populist "Alternative for Germany" (AfD) party in the last couple of elections.  The only other one that is distinguishable is the PDS, the successor to the East German Communist party, which started out higher in "illiberalism" but soon became similar to the other parties. 


Things get more interesting when you look at emerging or unstable democracies.  In Mexico, the Institutional Revolutionary Party was high in "illiberalism," but now has a more moderate value.  Note also that all three of the major parties increased their values in 2006, when there was a close election with a disputed outcome. 

Then there is the United States:  

There was a clear increase for the Republican party after 2000, and a big jump in 2016.  It seems safe to say that there will be another increase when they get 2020 in there.  

What has happened in the United States is very unusual, and may be unique.  I'll look more closely at the data in the future to see if there are any other cases of a major party in an established democracy dramatically increasing its illiberalism score.  

The index is based on expert judgments, and of course you could disagree with those judgments.  I agree about the differential trends for the Democratic and Republican parties, but think there's something funny about the levels.  The Republican values in 2016-18 are about 0.7, roughly equal to the AfD and considerably higher than the French Communist party of the 1970s (which was about 0.45).  Even with the way it is now, I'd say that the Republican party is more committed to democracy than the AfD is or the French Communists were.  Also, the American scores are consistently higher than other democracies--at their lowest, the Democrats were typically about .12 and the Republicans about 0.18, considerably higher than the Australian or German parties.  The United States has a very unusual political system, and I think that the V-Dem approach to measurement doesn't fit as well here as in most democracies.  I'll also consider that point in a future post. 


Saturday, May 15, 2021

Tolerance, part 7

 A couple of weeks ago, Philip Bump had a column about Senator Tim Scott's response to Joe Biden.  One of Scott's themes was criticism of "cancel culture."  Bump said:

"Scott’s argument about discussions of race centered on education because of the right’s current focus on 'cancel culture,' on the idea that there is a concerted effort to silence people who aren’t adhering to certain cultural standards. The General Social Survey has an interesting bit of data speaking to that issue, as it turns out. The survey asks Americans if racists should be allowed to teach — in other words, if individuals who are racist should be teachers. About 37 percent of Democrats say they should be allowed to teach, while about half of Republicans hold that position."

"This is admittedly an unusual scenario, but it does speak to the broader debate. This is an individual embedded in the educational system. Half of Republicans don't take issue with that person being there."

Bump's figures appear to be from the 2018 GSS, but the question goes back to the 1970s.  People who called themselves liberals were traditionally more likely to say that the "person who believes that blacks are genetically inferior" should be allowed to teach in a college or university.  This relationship has shifted--in 2018, people who called themselves "extremely liberal" were less likely to think that the person should be allowed to teach and there were no clear differences among other ideological groups.  As far as party, over the whole period independents were most likely to say that the person should be allowed to teach, followed by Republicans, with Democrats the least likely.  In 2018, Democrats were least likely (38%), Republicans most likely (51%), and independents in the middle (42%).  

In an effort to get some insight into why these changes happened, I looked at the association of opinions on this issue with some other opinions:  four questions about the reasons for racial inequality, one on whether there should be a law against discrimination in home sales, and one on whether there should be laws against interracial marriage.  In order to keep the signs straight, I coded the answers as liberal or conservative, with "liberal" defined as:  inequality due to discrimination, inequality not due to in-born ability, inequality due to chance for education, inequality not due to motivation and willpower, homeowner should not be allowed to discriminate, should not be a law against marriage between blacks and whites, and a racist should be allowed to teach in college.  (Some people would disagree about the last one, but it's my blog and I'll call it the liberal position if I want to).  So a positive association means that liberal opinions on that issue go with the liberal position on tolerance.  Because most of the variables are binary and some have lopsided distributions, I use log-odds as the measure of association.  To reduce sampling variation, I consider groups of years, which are 1976-84, 1994-2004, and 2014-18. 

                                    1976-84    1994-2004        2014-18

Discrim                        .23            -.18                -.19

Ability                         .34              .22                 .43

Educ                            .36              .10                -.10

Willpower                    .55             .33                  .35

Housing                       .04            -.14                  -.39

Marriage                       .65            .33                  *


  In the early period, belief that a racist should be allowed to teach in a college was associated with more liberal opinions on all issues (although the association with opinions on open housing was very small).  There has been a shift--now it is associated with more conservative opinions on three of the issues.  However, it's not a complete reversal--people who say that racial inequality is due to differences in in-born ability or lack of willpower among blacks are still more likely to say that the racist should not be allowed to teach.  That may seem like a contradiction--people saying that people who share their views should not be allowed to teach--so I'll give the cross-tabulation for 2014-8 to show that I'm not making a mistake:

                                                                          Allowed           Not allowed           N

Yes, differences due to in-born ability                   37%                  63%               332

No, not due to in-born ability                                 45%                    55%              938


Why do we get this pattern of change?  In an earlier post, I said that there were two views about the relationship between tolerance and ideology:  "now the left has a dominant position in some major social institutions (particularly academia and the media), it has the power to repress and is starting to like it.  On the other side, the right is weak in those institutions, so it's now calling for tolerance.  .  . .   On the other side, the main argument is there is some basic psychological affinity between the left/right views and attitudes towards authority--the left tends to be suspicious of authority, while the right tends to be pro-authority (and sometimes authoritarian)."  Maybe both are true, and they don't work in exactly opposite directions?  It's often been observed that liberals tend to have a more optimistic view of human nature.  One aspect of this optimism is a belief that most people can come to the right decision if they're given a chance to listen to all points of views.  Conservatives are more likely to think that some people just don't have the ability or desire to think things through.    Putting it together:  conservatives are generally more likely favor the general principle that people have to be protected against bad ideas, but liberals are increasingly likely to think that the idea that blacks are genetically inferior is especially bad and less constrained by concern that repression could be turned against the left.  The reason that this doesn't lead to a reversal of all the associations is that the questions about ability and willpower tap more strongly into the "protect against bad ideas" aspect of the conservative disposition. 


*question not asked

Saturday, May 8, 2021

An improbable event

 My last post was about a question on whether "the government is trying to do too many things that should be left to individuals and businesses" or "the government should do more to solve our country’s problems."  In recent surveys, opinions on that question were farther to the left (government should do more) than they ever had been since the question was first asked in the mid-1980s.  I said that the GSS had asked essentially the same question in 1975 and 1983, and that a NORC survey had asked it in 1974, making it possible to take the history back farther, and that I would do that in a future post, although probably not the next one.  But improbable things happen sometimes, so I will do it in this post.  

The questions I wrote about last time all involved a choice between two statements.  The NORC questions asked people to place themselves on scales ranging from full agreement with one statement to full agreement with the other.  The GSS used a 5-point scale, and the earlier NORC survey used a seven-point scale, so there was a point that was midway in between the two.  In order to make the values comparable, I calculated the ratio of people who placed themselves closer to the "government should do more" end to those who placed themselves closer to the "doing to many things" end, omitting those who took the middle option, and took the logarithm of that ratio.  The results:


There is a lot of short-term variation and no clear trend.  In 2014, opinions were the most conservative ever--by 2018, they were the most liberal since 1990.  In the question I considered last time, opinions became more conservative in the early 1990s, and then more liberal--in the GSS, they became more conservative throughout the 1990s.  

What if we look at them all together?


Here they are, with the NORC/GSS results in red.  There's a lot of variation among surveys taken at approximately the same time, which seems reasonable to me--I think that answers to this question might be more affected by context than most (e. g., more conservative if preceded by questions about taxes than if preceded by questions about education and health care).  Some of the GSS results are a bit out of line with those in most contemporary surveys, but none are real outliers.  So it seems reasonable to take them all together.  In order to show the trend more clearly, I use a smoothed estimate.*


In my last post, I said that the current leftward movement started in the "early 2010s and has been pretty steady."  On closer examination, I don't think that's true, or at least not clear.  There wasn't much change through 2014, and then there was a gap until the GSS in the first part of 2016.  There were only two other questions in 2016, and they were November and December.  So it's hard to say what was happening in the last few years of the Obama administration, but opinions definitely became more liberal under Trump, and are now to the left of where they were in the mid-1970s and early 1990s.  There is some tendency for opinions to go left under Republicans and to the right under Democrats, however, so that may not last.  As I've mentioned before, the early 1990s really stand out for a strong rightward movement.  People tend to ascribe Republican success in the 1994 elections to Newt Gingrich's strategy, but I think there was definitely more going on, although I'm not sure what it was.  


*There are lots of methods of smoothing, and things are complicated because these observations aren't equally spaced.  I tried several and picked the one that had the best match to my own impressions.

[Data from the Roper Center for Public Opinion Research]