Deirdre McCloskey had a piece in the NY Times on Sunday called, "Growth, Not Forced Equality, Saves the Poor." In it, she wrote "As a matter of arithmetic, expropriating the rich to give to the poor does not uplift the poor very much. If we took every dime from the top 20 percent of the income distribution and gave it to the bottom 80 percent, the bottom folk would be only 25 percent better off." That didn't sound plausible to me, so I looked up figures on the distribution of income. There are lots of sources, but the one that came up first was from the Congressional Budget Office.
Rather than interpreting "take every dime" literally, I calculated what would happen if you gave to the bottom quintile until they caught up with the second, then gave equally to the first and second until they caught up with the third, etc., and stopped when the top quntile had been reduced to the level of the fourth. I call that the egalitarian formula. I also calculate an alternative in which the money is distributed equally to the four lowest quintiles, again stopping when the top quintile is at the same level as the fourth.
Actual Egalitarian Flat-rate
Top $188,000 $83,000 $104,000
2nd $83,000 $83,000 $104,000
3d $59,000 $77,000 $80,000
4th $42,000 $77,000 $63,000
Bottom $24,000 $77,000 $45,000
The numbers refer to housholds in 2011, and the "actual" are after taxes and transfers. The average gain in the bottom four quintiles would be a lot more than 25%--the bottom three would gain by more than 25% under either formula. Of course, if redistribution led to slower economic growth (and extreme redistribution like this probably would) it would not help the poor in the long run, but it would take quite a while for lost growth to offset the immediate gains. To quote John Stuart Mill again "The relaxation of industry and activity, and diminished encouragement to saving which would be their ultimate consequence, might perhaps be little felt by the class of unskilled labourers in the space of a single lifetime."
Where did McCloskey get the 25% figure? Given the magnitude of the discrepancy, it can't be a matter of using figures from a different year, or individuals instead of households, or some other technical issue. If you interpret "take every dime" literally, start with 20 and divide it 4 ways, that gives 5, which is indeed 25% of 20. That is, she didn't take account of the fact that people in the top quintile of incomes have higher incomes than people in bottom four quintiles. That's the only explanation I can think of. That leads to the question of how someone who is not just a trained economist, but a Distinguished Professor (emerita) of Economics, History, English, and Communication could make this kind of blunder, but I'm not going to try to answer that.
Tuesday, December 27, 2016

Monday, December 19, 2016
Yes you can
Paul Krugman has a blog post called "What do Trump voters want"? The obvious answer for most of them was a Republican president, but Krugman was concerned with the working-class voters who shifted from voting Democratic in previous elections. He concluded that "I don’t think any kind of economic analysis can explain this. It has to be about culture and, as always, race." His reasoning was that these voters were going against their economic interests, since they benefited from government spending that Trump was likely to cut.
I think he's giving up on economic analysis too quickly. As John Stuart Mill said, people "never . . . save in very exceptional cases . . . direct their conduct by their real ultimate interest, in opposition to their immediate and apparent interest." Trump could appeal to an "immediate and apparent interest"--protecting American jobs. A professional economist would say that restricting trade wasn't in the "real ultimate interest" of Americans generally, but many people, especially people with less education, aren't convinced by or even aware of the arguments for free trade. Also, not everyone gains--the benefits are spread widely, in the form of lower prices, while the costs are concentrated on the workers who are most exposed to foreign competition--that is, on factory workers, or people who would like to get a factory job instead of a poorly paid service job. In principle, the government could increase taxes enough to compensate the "losers" and leave everyone better off, but no one is foolish enough to imagine that will actually happen. So it's understandable that Trump's promise of "America First" and rejection of trade deals appealed to less educated voters, especially since the Clinton campaign didn't make much effort to reply to it. As Mill said, "protection of the home producer against foreign industry" is one of the "very natural . . . results of a feeling of class interest in a governing majority of manual laborers."
I don't have any direct evidence for this interpretation, but we can look at the pattern of state differences. The states in which Trump did well were pretty much the same as those in which Romney did well in 2012 (see the figure), but there were some differences.

Trump's biggest gains over Romney were in North Dakota, West Virginia, Iowa, South Dakota, and Maine. Those states are all overwhelmingly white. You could argue that means that the changes really were about race--people are more afraid of the "other" when they hadn't had much exposure to diversity. But there's a long tradition, which has empirical support, holding that race is more important to white voters in places that are more racially diverse. For example, when people talked about "Reagan Democrats" in 1980 they meant white working-class voters in places like the New York, Philadelphia, and Detroit metropolitan areas (see this paper).
Although the states that shifted to Trump are all rural and overwhelmingly white, their economic situations vary widely. West Virginia has one of the highest unemployment rates of all states, while the Dakotas are among the lowest. The same is true for rates of disability. One thing I think that they have in common, although I can't find any clear data, is the importance of extractive industries--lumber in Maine, and energy in the others (coal in West Virginia, the Keystone pipeline in the Dakotas, and ethanol production in Iowa). It seems like the "immediate and apparent" interest of people in those states aligned with Trump.
I think he's giving up on economic analysis too quickly. As John Stuart Mill said, people "never . . . save in very exceptional cases . . . direct their conduct by their real ultimate interest, in opposition to their immediate and apparent interest." Trump could appeal to an "immediate and apparent interest"--protecting American jobs. A professional economist would say that restricting trade wasn't in the "real ultimate interest" of Americans generally, but many people, especially people with less education, aren't convinced by or even aware of the arguments for free trade. Also, not everyone gains--the benefits are spread widely, in the form of lower prices, while the costs are concentrated on the workers who are most exposed to foreign competition--that is, on factory workers, or people who would like to get a factory job instead of a poorly paid service job. In principle, the government could increase taxes enough to compensate the "losers" and leave everyone better off, but no one is foolish enough to imagine that will actually happen. So it's understandable that Trump's promise of "America First" and rejection of trade deals appealed to less educated voters, especially since the Clinton campaign didn't make much effort to reply to it. As Mill said, "protection of the home producer against foreign industry" is one of the "very natural . . . results of a feeling of class interest in a governing majority of manual laborers."
I don't have any direct evidence for this interpretation, but we can look at the pattern of state differences. The states in which Trump did well were pretty much the same as those in which Romney did well in 2012 (see the figure), but there were some differences.

Trump's biggest gains over Romney were in North Dakota, West Virginia, Iowa, South Dakota, and Maine. Those states are all overwhelmingly white. You could argue that means that the changes really were about race--people are more afraid of the "other" when they hadn't had much exposure to diversity. But there's a long tradition, which has empirical support, holding that race is more important to white voters in places that are more racially diverse. For example, when people talked about "Reagan Democrats" in 1980 they meant white working-class voters in places like the New York, Philadelphia, and Detroit metropolitan areas (see this paper).
Although the states that shifted to Trump are all rural and overwhelmingly white, their economic situations vary widely. West Virginia has one of the highest unemployment rates of all states, while the Dakotas are among the lowest. The same is true for rates of disability. One thing I think that they have in common, although I can't find any clear data, is the importance of extractive industries--lumber in Maine, and energy in the others (coal in West Virginia, the Keystone pipeline in the Dakotas, and ethanol production in Iowa). It seems like the "immediate and apparent" interest of people in those states aligned with Trump.
Monday, December 12, 2016
History repeats itself
A number of people have remarked on parallels between Donald Trump and Senator Joe McCarthy (e. g. this post from Andrew Gelman in June). In light of the election results, there's another one: they both got more support among less educated people. In November, 1954, a NORC survey asked "all things considered, would you say you think favorably of Senator McCarthy, or unfavorably." The breakdown was:
Favorably Unfavorably DK
Not HS Grad 46% 29% 25%
HS Grad 47% 34% 19%
Some College 43% 47% 10%
College Grad 36% 58% 6%
TOTAL 45% 35% 21%
TOTAL 45% 35% 21%
There were class differences as well; if you define class by the occupation of the main wage earner, the breakdown is:
White collar 42% 43% 15%
Blue collar 48% 30% 22%
Farm 43% 26% 31%
but they were mostly due to education--net of education, the only clear difference is between professionals and all other occupations.
At the time of this survey, McCarthy was near the end of his run. A Senate resolution to censure him had been proposed in July, and a bipartisan committee "whose members were notable for their impeccable reputations and legal expertise" had been appointed to investigate. The gave their report at the end of September, and unanimously recommended censure. The Senate reconvened on November 8 to hear the case, and on December 2 passed a motion of censure by 67-22, with about half of the Republicans (who had a majority in the Senate) voting in favor. Another NORC survey in January 1955 asked the same question. The results were 39% favorably, 42% unfavorably, and 29 didn't know: a definite shift against McCarthy, but he still had substantial popular support. Among people who had not graduated from high school, who were the largest group at the time, favorable views outnumbered unfavorable ones.
This reminded me of a post-election commentary by Luigi Zingales. He compared Trump to Silvio Berlusconi, and said that "Mr. Berlusconi was able to govern Italy for as long as he did mostly thanks to the incompetence of his opposition. It was so rabidly obsessed with his personality that any substantive political debate disappeared; it focused only on personal attacks, the effect of which was to increase Mr. Berlusconi’s popularity" and said that the Clinton campaign had made the same mistake. A general statement that personal attacks increase a candidate's popularity is clearly false, but I think there's a core of truth here: attacks for violating norms of civility, good taste, or the dignity of the office are not very effective among less educated people, who are are less likely to know or care what the norms are, or to recognize unsavory historical echoes (e. g., "America First"). Trump provided many opportunities for attacks on these grounds (as had Berlusconi and McCarthy); as a result, the Democrats neglected angles that might have been more effective.
Zingales also said that "Hillary Clinton was so focused on explaining how bad Mr. Trump was that she too often didn’t promote her own ideas, to make the positive case for voting for her." I don't think that she needed to do that much to promote her ideas--the principles of increasing regulation of business and government programs intended to help the middle class and the poor are already familiar. What she didn't do was respond to his attacks on trade agreements and his claims that there was no border security. Those were issues that previous Republican presidential candidates had not pushed, and they appealed to many voters. Trump gave voters some novel and plausible reasons to vote for him; Clinton countered with arguments that were effective with only some of the voters--more educated and sophisticated ones. I think that combination explains why Trump did better than previous Republican nominees among less educated voters.
[Data from the Roper Center for Public Opinion Research]
At the time of this survey, McCarthy was near the end of his run. A Senate resolution to censure him had been proposed in July, and a bipartisan committee "whose members were notable for their impeccable reputations and legal expertise" had been appointed to investigate. The gave their report at the end of September, and unanimously recommended censure. The Senate reconvened on November 8 to hear the case, and on December 2 passed a motion of censure by 67-22, with about half of the Republicans (who had a majority in the Senate) voting in favor. Another NORC survey in January 1955 asked the same question. The results were 39% favorably, 42% unfavorably, and 29 didn't know: a definite shift against McCarthy, but he still had substantial popular support. Among people who had not graduated from high school, who were the largest group at the time, favorable views outnumbered unfavorable ones.
This reminded me of a post-election commentary by Luigi Zingales. He compared Trump to Silvio Berlusconi, and said that "Mr. Berlusconi was able to govern Italy for as long as he did mostly thanks to the incompetence of his opposition. It was so rabidly obsessed with his personality that any substantive political debate disappeared; it focused only on personal attacks, the effect of which was to increase Mr. Berlusconi’s popularity" and said that the Clinton campaign had made the same mistake. A general statement that personal attacks increase a candidate's popularity is clearly false, but I think there's a core of truth here: attacks for violating norms of civility, good taste, or the dignity of the office are not very effective among less educated people, who are are less likely to know or care what the norms are, or to recognize unsavory historical echoes (e. g., "America First"). Trump provided many opportunities for attacks on these grounds (as had Berlusconi and McCarthy); as a result, the Democrats neglected angles that might have been more effective.
Zingales also said that "Hillary Clinton was so focused on explaining how bad Mr. Trump was that she too often didn’t promote her own ideas, to make the positive case for voting for her." I don't think that she needed to do that much to promote her ideas--the principles of increasing regulation of business and government programs intended to help the middle class and the poor are already familiar. What she didn't do was respond to his attacks on trade agreements and his claims that there was no border security. Those were issues that previous Republican presidential candidates had not pushed, and they appealed to many voters. Trump gave voters some novel and plausible reasons to vote for him; Clinton countered with arguments that were effective with only some of the voters--more educated and sophisticated ones. I think that combination explains why Trump did better than previous Republican nominees among less educated voters.
[Data from the Roper Center for Public Opinion Research]
Wednesday, December 7, 2016
Declining support for democracy?
Last week, the New York Times reported on research by Roberto Foa and Yascha Mounk that saw a decline in popular support for democracy. (The paper it talked about is not out yet, but Foa and Mounk published a related article this summer). This surprised me, since support for democracy and opposition to authoritarianism is strongly related to education, and average levels of education are rising throughout the world. Also, there seems to have been a general cultural drift, in which political movements of the left, right, and center all claim to be working to give more power to the people. Of course, their actions might sometimes damage democracy, but it seems like everyone appeals to democracy as a principle.
I looked at the World Values Survey (the major data source for Foa and Mounk), which contains several general questions about forms of government:
"Various types of political systems are described below. Please think about each choice in terms of governing this country and indicate if you think that it would be a very good, fairly good, fairly bad or very bad way of governing [your nation]:
a. Having a strong leader who does not have to bother with parliament and elections
b. Having experts, not government, make decisions according to what they think is best for the country
c. Having the army rule
d. Having a democratic political system"
The questions are included in four waves of the WVS: 1994-8, 1999-2004, 2005-9, and 2010-14. The prevailing view seems to be that support for democracy may be weak and unstable at first, but that once democracy is firmly established, you don't go back, so I limited it to nations in the latest wave that have a history of stable democracy. I calculated a summary of opinions--ratings of democracy minus the ratings of all the others. For example, in 1994 the average rating was 3.4 (4="very good," .... 1= "very bad") for democracy, 2.1 for experts, 1.5 for a strong leader, and 1.3 for the army, for a score of 3.4-2.1-1.5-1.3=-1.5. The actual value is not meaningful--interest is in how it compares to other nations, with higher numbers meaning more support for democracy relative to the alternatives. The results:

The United States ranked highest in support for democracy in 1994-8, but lowest in all subsequent waves. In the other nations, there was fluctuation with no clear trend--the United States stands out for its sustained decline.
Rule by the army or a strong leader are clearly non-democratic, but having experts make decisions is more ambiguous. People could be thinking of something like the Federal Reserve Board in the United States, which is accountable to the public in some sense. So I computed an alternative of rating of democracy minus rating of rule by the army or a strong leader.

The results are pretty much the same, although the contrast between the United States and everyone else is a little more striking. So the United States is different--it's certainly had a larger decline in support for democracy, and is arguably the only one of these nations to have had a decline.
Why? One possibility would be poor results--if democracy isn't delivering the goods, people will lose confidence in it. This might be a factor in some of the changes, like the decline in support for democracy in Spain between 2005-9 and 2010-4, when that country was hit hard by the recession. But it declined substantially in the United States between 1994 and 1999, when the economy was doing well, the country wasn't involved in any wars or threatened by foreign powers, and crime was dropping. Another possibility is that people are reacting against political polarization and conflict. Although people sometimes recall the 1990s as a period of relative good feeling, the news was dominated by a long series of investigations of Bill Clinton starting in 1994 and culminating in nearly party-line votes on his impeachment in 1999, with a little time out for a government shutdown in 1995. That sort of thing has continued in the 21st century. Another factor may have been increasing deference to the military making people more receptive to the idea of rule by the army. Although my knowledge of the recent political history of most of the other nations is sketchy, I think that the United States is the only one that's had a dramatic increase in polarization. The position of the military is certainly unique. Overall, we seem to have a case of American exceptionalism, but not in a good sense.
I looked at the World Values Survey (the major data source for Foa and Mounk), which contains several general questions about forms of government:
"Various types of political systems are described below. Please think about each choice in terms of governing this country and indicate if you think that it would be a very good, fairly good, fairly bad or very bad way of governing [your nation]:
a. Having a strong leader who does not have to bother with parliament and elections
b. Having experts, not government, make decisions according to what they think is best for the country
c. Having the army rule
d. Having a democratic political system"
The questions are included in four waves of the WVS: 1994-8, 1999-2004, 2005-9, and 2010-14. The prevailing view seems to be that support for democracy may be weak and unstable at first, but that once democracy is firmly established, you don't go back, so I limited it to nations in the latest wave that have a history of stable democracy. I calculated a summary of opinions--ratings of democracy minus the ratings of all the others. For example, in 1994 the average rating was 3.4 (4="very good," .... 1= "very bad") for democracy, 2.1 for experts, 1.5 for a strong leader, and 1.3 for the army, for a score of 3.4-2.1-1.5-1.3=-1.5. The actual value is not meaningful--interest is in how it compares to other nations, with higher numbers meaning more support for democracy relative to the alternatives. The results:

The United States ranked highest in support for democracy in 1994-8, but lowest in all subsequent waves. In the other nations, there was fluctuation with no clear trend--the United States stands out for its sustained decline.
Rule by the army or a strong leader are clearly non-democratic, but having experts make decisions is more ambiguous. People could be thinking of something like the Federal Reserve Board in the United States, which is accountable to the public in some sense. So I computed an alternative of rating of democracy minus rating of rule by the army or a strong leader.

The results are pretty much the same, although the contrast between the United States and everyone else is a little more striking. So the United States is different--it's certainly had a larger decline in support for democracy, and is arguably the only one of these nations to have had a decline.
Why? One possibility would be poor results--if democracy isn't delivering the goods, people will lose confidence in it. This might be a factor in some of the changes, like the decline in support for democracy in Spain between 2005-9 and 2010-4, when that country was hit hard by the recession. But it declined substantially in the United States between 1994 and 1999, when the economy was doing well, the country wasn't involved in any wars or threatened by foreign powers, and crime was dropping. Another possibility is that people are reacting against political polarization and conflict. Although people sometimes recall the 1990s as a period of relative good feeling, the news was dominated by a long series of investigations of Bill Clinton starting in 1994 and culminating in nearly party-line votes on his impeachment in 1999, with a little time out for a government shutdown in 1995. That sort of thing has continued in the 21st century. Another factor may have been increasing deference to the military making people more receptive to the idea of rule by the army. Although my knowledge of the recent political history of most of the other nations is sketchy, I think that the United States is the only one that's had a dramatic increase in polarization. The position of the military is certainly unique. Overall, we seem to have a case of American exceptionalism, but not in a good sense.
Friday, December 2, 2016
Going downhill
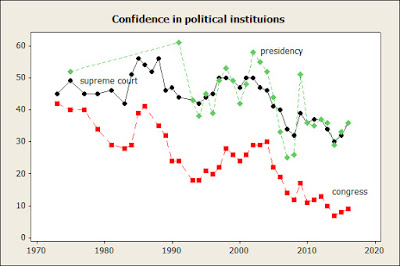
Since the 1970s, the Gallup Poll has asked "I am going to read you a list of institutions in American society. Please tell me how much confidence you, yourself, have in each one--a great deal, quite a lot, some, or very little?" The list has changed, but there is at least twenty years of data for the following: the church or organized religion, the military, the US Supreme Court, banks, the public schools, newspapers, Congress, television news, organized labor, the presidency, the police, the medical system, the criminal justice system, and big business. Tables giving the data are available at the Gallup website. I converted them to figures in order to get a clearer sense of changes--the y-axis gives the percent saying they have "a great deal" or "quite a lot" of confidence.
I don't think anyone will be surprised to see that confidence in all three branches of government has declined, with Congress taking the biggest loss:
Or confidence in the media:

Confidence in big business and labor was never high, but it's declined for both. Confidence in banks had ups and downs, but was generally pretty high until the onset of the 2007-8 recession, when it suffered a fall from which it hasn't bounced back:

Confidence in medicine, the public schools,and organized religion also declined.

So far, confidence in everything has declined. You could offer specific explanations for each one, but the fact that it's so widespread suggests that the declines reflect a general mood of dissatisfaction. I think the decline for public schools is particularly telling, since if you go by the numbers academic performance has improved since the 1970s.
But the decline in confidence isn't universal:

Confidence in police and the criminal justice system has stayed about the same since the early 1990s, and confidence in the military has clearly increased since the 1970s.
Today, confidence in the military is substantially higher than confidence in any of the other institutions; in the 1970s, the military was behind religion and the medical system, and essentially tied with the public schools (also behind banks, but the poll asked about them only once in the 1970s).
It's not possible to say what the "right" degree of confidence in any institution is. Still, a situation in which confidence is highest in the military and the police doesn't seem healthy.
I don't think anyone will be surprised to see that confidence in all three branches of government has declined, with Congress taking the biggest loss:

Or confidence in the media:

Confidence in big business and labor was never high, but it's declined for both. Confidence in banks had ups and downs, but was generally pretty high until the onset of the 2007-8 recession, when it suffered a fall from which it hasn't bounced back:

Confidence in medicine, the public schools,and organized religion also declined.

So far, confidence in everything has declined. You could offer specific explanations for each one, but the fact that it's so widespread suggests that the declines reflect a general mood of dissatisfaction. I think the decline for public schools is particularly telling, since if you go by the numbers academic performance has improved since the 1970s.
But the decline in confidence isn't universal:

Confidence in police and the criminal justice system has stayed about the same since the early 1990s, and confidence in the military has clearly increased since the 1970s.
Today, confidence in the military is substantially higher than confidence in any of the other institutions; in the 1970s, the military was behind religion and the medical system, and essentially tied with the public schools (also behind banks, but the poll asked about them only once in the 1970s).
It's not possible to say what the "right" degree of confidence in any institution is. Still, a situation in which confidence is highest in the military and the police doesn't seem healthy.
Wednesday, November 23, 2016
Public opinion on immigration, 1965-
In June 1965, the Gallup Poll asked "Should immigration be kept at its present level, increased or decreased?" (this was when the Hart-Celler Act was under consideration by Congress). The same question was asked once in the 1970s, once in the 1980s, and pretty frequently since 1993. There have been some variations in the way it was introduced (e. g., sometimes it is "In your view, should...") but they don't seem to make any difference. The figure shows average opinion, counting increased as +1, decreased as -1, and present level as zero, for people who expressed an opinion.

My initial impression was just that there were always more people in favor of a decrease than an increase, but when I graphed the data I realized that there was a definite pattern: more support for a decrease until the mid-1990s, and then increasing support for immigration after that time. There are some ups and downs, notably a drop in support for increased immigration after 9/11, but the trend after the mid-1990s is clear.
This figure shows the percent favoring an increase:

Before the 1990s, almost all of the change in the average involved a shift from staying the same to decreased--after that time, much of it involved a rise in the number of people saying it should be increased.
As a Thanksgiving bonus, here are some pre-1965 questions on immigration:
Roper/Fortune Survey [November, 1947]
Would you vote yes or no on a bill in Congress to let 100,000 selected European refugees come to this country in each of the next four years, in addition to the 150,000 immigrants now permitted to enter every year under our present quotas?
18% Yes
72% No
5% Depends
5% Don't know
------------------------------------------------------------
Foreign Affairs Survey [April, 1955]
In general, do you think the United States is letting too many immigrants come into this country, or not enough?
39% Too many
37% About right (vol.)
13% Not enough
11% Don't know
------------------------------------------------------------
Hopes And Fears [September, 1964]
Do you think the number of immigrants allowed to enter the U.S. each year should be increased somewhat, decreased somewhat, or kept at about the present level?
6% Increased
38% Decreased
46% Kept at present level
10% Don't Know
------------------------------------------------------------
Harris Survey [May, 1965]
President (Lyndon) Johnson has proposed that the immigration laws of this country be changed to allow more people into the United States as immigrants. From what you know or have heard, do you favor or oppose letting more people come to the United States as immigrants?
24% Favor
58% Oppose
18% Not sure

My initial impression was just that there were always more people in favor of a decrease than an increase, but when I graphed the data I realized that there was a definite pattern: more support for a decrease until the mid-1990s, and then increasing support for immigration after that time. There are some ups and downs, notably a drop in support for increased immigration after 9/11, but the trend after the mid-1990s is clear.
This figure shows the percent favoring an increase:

Before the 1990s, almost all of the change in the average involved a shift from staying the same to decreased--after that time, much of it involved a rise in the number of people saying it should be increased.
As a Thanksgiving bonus, here are some pre-1965 questions on immigration:
Roper/Fortune Survey [November, 1947]
Would you vote yes or no on a bill in Congress to let 100,000 selected European refugees come to this country in each of the next four years, in addition to the 150,000 immigrants now permitted to enter every year under our present quotas?
18% Yes
72% No
5% Depends
5% Don't know
------------------------------------------------------------
Foreign Affairs Survey [April, 1955]
In general, do you think the United States is letting too many immigrants come into this country, or not enough?
39% Too many
37% About right (vol.)
13% Not enough
11% Don't know
------------------------------------------------------------
Hopes And Fears [September, 1964]
Do you think the number of immigrants allowed to enter the U.S. each year should be increased somewhat, decreased somewhat, or kept at about the present level?
6% Increased
38% Decreased
46% Kept at present level
10% Don't Know
------------------------------------------------------------
Harris Survey [May, 1965]
President (Lyndon) Johnson has proposed that the immigration laws of this country be changed to allow more people into the United States as immigrants. From what you know or have heard, do you favor or oppose letting more people come to the United States as immigrants?
24% Favor
58% Oppose
18% Not sure
Thursday, November 10, 2016
Mistakes were made, part 2
Before asking how Donald Trump won the election, it's necessary to ask how he even stayed close. There were numerous occasions when it seemed that he'd gone too far, and done or said something that would finish him off. The answer to that question can be found in some of the classics of early public opinion research:

1. Most people don't pay much attention to politics (Campbell, Converse, Miller, and Stokes, The American Voter).
2. When they do, they usually confirm their prior inclinations (Berelson, Lazarsfeld, and McPhee, Voting).
So a lot of people voted for Trump because he was a Republican and Hillary Clinton was a Democrat. Others voted for him because they felt like the Democrats had had a chance and now it was time for a change. Although this point is not very exciting, it's important. Many discussions of Trump voters treat them as exotic--out there in West Virginia or Ohio, in towns devastated by the loss of an industry like steel or coal. But a lot of Trump voters can be found closer to the media centers, in nice, well-kept houses with Trump signs out front. For example, Connecticut is a "blue state," and Clinton won easily--but Trump still got 41.7% of the vote and carried about half of the towns. In fact, Trump got more votes in Connecticut than in West Virginia.
But there were some differences between who supported Trump and who had supported Romney, McCain, Bush, etc. Probably the most important one was education. Exit polls showed that 67% of whites without a college degree, and only 49% of those without a college degree voted for Trump. The figure shows the gap in Republican support in elections since 1980.

There was not much change between 1980 and 2012--sometimes the Republicans did a little better among people with a college degree, sometimes a little worse (the two in red are 1992 and 1996, when Ross Perot was a candidate). Suddenly the gap became much larger in 2016. Compared to 2012, Republican support among whites with a college degree dropped from 56% to 49%, while support among those without a college degree rose from 61% to 67%. That change suggests that something about Trump appealed to people without a college degree and repelled people with a college degree.
Early public opinion research also helps to explain why Trump repelled more educated people: they give more support to civil liberties and have more awareness of and concern with the norms of democratic government. For example, sophisticated observers were shocked when Trump told Hillary Clinton that she would be in jail if he were president (even Charles Krauthammer said that was going too far)--in a democracy, you don't put political opponents in jail. But for someone who didn't know much about the history or theory of democracy, it wouldn't seem like a big deal--if she was guilty of a crime, shouldn't she be in jail? And if there was even a chance she was guilty--and lots of people were saying that she was--why not appoint a special prosecutor to find out?
What about his positive appeal? This is something I've written about several times over the last year or two (see the list at the end of this post): Trump is an economic nationalist, opposed to immigration, free trade, saying he'd punish companies that move jobs overseas. These are all popular positions, and especially popular among less educated people. They also haven't had many advocates among major American politicians, so Clinton and the Democrats didn't have much practice in countering them.
This raises the question of whether other people will be inspired by his success to appeal to the same sentiments, so that the educational split will remain. I'll discuss that in a later post.
Related posts:
Subscribe to:
Posts (Atom)