Sunday, May 31, 2015

Victims of false consciousness

In my last post, I looked at people's expectations of how their children's standards of living would compare with their own.  There was a negative relationship:  people with higher incomes expect their children to do worse, relative to them.  But the correlation seemed weak to me, at -.07.

It occurred to me that there are data on parent's and children's position in the income distribution which could be used to determine how strong the correlation "should" be.  The data, which I discussed in a post about a year ago, are from the Equality of Opportunity Project, which derived them from income tax returns.  There are two variables:  parent's position in the income distribution when you were growing up (I think it was at about age 15), and your position in the income distribution at age 30.  Both are percentiles, so they range from 1 to 100.

If you call parent's percentile P and children's percentile C, you can create a variable C minus P, that represents change from parent's position.  It ranges from -99 (someone whose parents were at the top and falls to the bottom) to +99 (parents were at the bottom and rises to the top).  The correlation between P and (C-P) is -.58, far larger than the correlation between income and expectations.  That means that high income parents are too optimistic, or low income parents are too pessimistic, or both.  

To make this more concrete, people with incomes over $150,000 make up about 9% of the Pew sample.  44% of them expect their children to have a higher standard of living than they do, and only 22% expect them to have a lower standard of living.  People with incomes below $10,000  made up about 7% of the Pew sample.   About 65% expected their children to have a higher standard of living and 22% expected them to have a lower standard of living.   Of the people whose parents were in the top 9% in the Equality of Opportunity data, only 3% were above their parents position and 95% were below.     Of people whose parents were in the bottom 7% in the Equality of Opportunity sample, 85% were above their parents position and about 10% were below.  

As I mentioned in my last post, this goes against what seems to be the standard view among social scientists, which is that poor people accept inequality because they are unrealistically optimistic about the prospects of upward mobility.  Although it may seem odd that affluent people should be the ones who suffer from "false consciousness," it makes sense (at least to me).  People tend to extrapolate from their own experience.  If someone has done well, they'll think of the world as pretty benign--if you keep trying, things will work out.  If someone hasn't, they'll see the world as a hard place, where something is always happening to stop you from getting ahead.

Tuesday, May 26, 2015

Whose mirage?

A Pew survey from early 2008 asked "When your children are the age that you are now, do you think their standard of living will be much better, somewhat better, about the same, somewhat worse, or much worse than yours is now?"  (The question was asked of everyone, not just parents, so in some cases the answers were about hypothetical children).


The answers, broken down by income groups:
                           
                 Much Better    Better   Same    Worse    Much 
                                                         worse
Under 20,000        37%           25%     16%     12%      9%
20-40,000           33%           26%     17%     13%     11%
40-50,000           33%           27%     19%     13%      9%
50-100,000          26%           27%     23%     19%      6%
over 100,000        23%           26%     29%     17%      6%

Of course, the correct answer is unknown, but it will depend on two things:  change in relative position and economic growth.  The prospects of change in relative position depend on your own position:  if you're at the bottom, your children aren't going to fall below you and are very likely to rise above you; if you're at the top, they can't rise and will be very likely to fall.  So compared to rich people, poor people should be more likely to expect that their children will be better off than they are.  

The table shows that there's some relationship of that kind, but it's not very strong.   I'm pretty sure that the relationship is weaker than it "should" be given the actual correlation between parents and children's income, even once you allow for the widening gap between high and low incomes.*  If that's the case, then people with low incomes are overly pessimistic about their children's chances and people with high incomes are overtly optimistic.  This would be opposite to the pattern that many social scientists think exists, in which poor people accept inequality because they imagine that they or their children will make it to the top one day:  see this article for an example.

 *It becomes weaker and is no longer statistically significant after controlling for race and Hispanic ethnicity (blacks and Hispanics have lower incomes than whites and expect more improvement for their children).

[Data from the Roper Center for Public Opinion Research]

Thursday, May 14, 2015

End of the middle?

The New York Times had a story the other day about how presidential candidates are avoiding the term "middle class" in favor of terms like "everyday Americans," "working families," etc.  The idea was that they are trying to appeal to a growing group of people who think of themselves as a little below the middle (what Australians would call "battlers").  Leaving the question of whether candidates' language has changed, I wondered whether people's views about their position in society have changed.   Since the 1970s, the General Social Survey has regularly asked "Compared with American families in general, would you say your family income is far below average, below average, average, above average, or far above average?"  Over the whole period, 1.8% said they were far above average, 17.0% said above average, 45.5% said average, 22% below average, and 5% said far below average.

As an aside, I'll mention what's perhaps the most ridiculous claim about public opinion that I've ever heard, which was made by  David Brooks in the New York Times and picked up by other media outlets: "the most telling polling result from the 2000 election was from a Time magazine survey that asked people if they are in the top 1 percent of earners. Nineteen percent of Americans say they are in the richest 1 percent and a further 20 percent expect to be someday."  The figures were actually from a question about something else--whether people expected to benefit from George Bush's proposed tax cuts (it mentioned in passing that Al Gore had said the cuts would benefit mostly the top one percent).

Returning to the main point, if we count far below average as 1, below average as 2 ... far above average as 5, the means are:


Something really has happened:  Average perception had gone up and down with no clear trend, but since 2006 has dropped to its lowest levels ever.  Looking at the distribution of individual responses, there seems to have been some shift even before then.  In the 1970s, less than 5% said far  below average, less than 2% said far above average, and about 55% said average.  By the early 2000s, about 6% said far below, about 3% far above, and less than half said average.  The last few years have seen a shift from average to below average.

Sunday, May 10, 2015

The Clever Fellows Strike Again

None of the stories on the British election that I read mentioned the popular vote, so I looked and found it here.  (Slightly less detailed results are now on Wikipedia).  The comparison with 2010 is interesting:

                    2010        2015    Change
Conservative       36.1%       36.9%   +0.8
Labour             29.0%       30.4%   +1.4
UKIP                3.1%       12.6%   +9.5 
Liberal Dem.       23.0%        7.9%  -15.1
SNP                 1.7%        4.7%   +3.0
Green               0.9%        3.8%   +2.9
BNP                 1.9%        0.0%   -1.9

In terms of seats, the Conservatives gained and Labour lost, but in terms of votes both were up very slightly over last time (Labour actually gained more).  I looked these figures up yesterday, and this morning saw a story in the New York Times called "Appeal to Dwindling Core Proves Costly for Labour Party in Britain." It said that  Labour had moved left to try to appeal to the manual working class, and lost the center.  Everyone they quoted said basically the same thing, but the best summary was:   "The more Labour drifts from the center the more it hurts, and they [Labour] may not like it, but Britain is a very moderate country . . . and risks outside the mainstream worried voters.”  

The figures above show, the mainstream (Labour, Conservatives, and Liberal Democrats) parties went from a combined 88% of the vote in 2010 to 75% in 2015, with the big loser being the party of the center.  The "outsiders" of the left (SNP and Greens), went from 2.6% to 8.5%, while the outsiders of the right (UKIP and BNP) went from 5% to 12.6%.  

In other words, the analysis was exactly backwards--the middle lost and the non-mainstream parties gained.  So why would someone offer an analysis like this?  My guess is that they think back to the elections of 1979-92, when Labour moved to the left, lost voters to the center (Liberals and Social Democrats, then Liberal Democrats), and lost four straight elections.  Journalists and academics are familiar with that history, so when Labour moves to the left and loses an election, it's natural to pull it out again.  Natural, but totally wrong.  

Wednesday, May 6, 2015

Clever fellows on the one side, damned fools on the other

I heard a piece on NPR's "Marketplace" about the upcoming British election.  They started by talking to two authorities who said that the economy was doing very well under under the Conservatives and had done much worse under the previous Labour government (according to one, Labour had "virtually destroyed the country").  Then they talked to some ordinary voters who said that things didn't seem so great to them.  So the story left the impression was that "all the clever fellows were on the one side, and all the damned fools were on the other," to quote the Duke of Wellington.

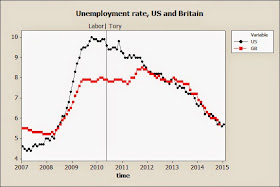
Here is a figure showing the unemployment rate in the US and Britain from 2007 until the beginning of 2015 (data from the Conference Board).  The vertical line at May 2010 shows when the current Conservative government took office.


British unemployment started out higher than American.  It rose as the recession got worse, but not as fast as in the United States.  By the time the Conservatives took office, it had stabilized at a bit under 8%, about 1.5% lower than the American rate.  For about eighteen months after that, unemployment declined in the United States, but actually rose in Britain.  Overall, Labour's record looks good considering the circumstances--8% unemployment is not where you want to be, but it's a lot better than 10%--while the Conservative record is fair or poor.  "By God, the damned fools were right," to finish the quotation.

Actually, the experts aren't as united as the Marketplace story suggested--a lot of economists think that the Conservative focus on reducing the budget deficit has been misguided.  In fact, I called the two people who were quoted "authorities," because "experts" would be misleading.  One was described as a "financial analyst"; the other was called an economist, but his biography says he is "a Fellow in Management Practice at the Saïd Business School, University of Oxford. . . . He is also Chairman and Chief Executive Officer of The Roosevelt Group, a leading strategic management and thought leadership company."  That is, they were both financial/business people--who usually have an ideological disposition, and maybe a financial stake, in supporting the Conservatives.  Paul Krugman regularly complains about journalists uncritically accepting "tough choices/structural reform/tighten our belts" analyses, and this seems to be a case in point.


Saturday, May 2, 2015

Land of opportunity?

We're going to be hearing a lot about social mobility over the next 18 months as presidential candidates talk about how they worked their way up from humble circumstances.  Scott Walker seems to have become a front-runner in this aspect of the campaign:  a recent story by Thomas Edsall quotes Sean Trende, senior elections analyst at RealClearPolitics, referring to his "working-class background," which reminded me that I'd read a number of others that said something similar.  Walker's father was a pastor, as most stories about him observe (his mother was a bookkeeper, according to the Wikipedia biography).  The Census puts "clergy" among the "professional specialty occupations," along with physicians, lawyers, engineers, and physicians. Its  NORC occupational prestige score is 68.96, which is a little below psychologist (69.39), but ahead of optometrist (67.16), and well ahead of skilled manual occupations like electrician, machinist, or plumber (45-50).  Of course, there's a lot of variation within occupations, so I thought that maybe his father led a little storefront church.  No, he was an American Baptist, which is a large denomination with a long history.  He had been an assistant pastor of a large church in Colorado before being promoted to pastor of a church in Iowa and later Wisconsin.

Walker's family was middle-class by any reasonable standard.  And when he left college, he took a job with the American Red Cross in either "finance and development" or "marketing and fundraising," (accounts differ).  So why do pundits talk about his working-class background?  My hypothesis is that the idea of the "white working class" has become mixed up with geography--the white working class is supposed to live in small cities and towns in the Midwest (basically from western Pennsylvania or West Virginia out to Wisconsin).  It seems to be part of the confusion of "red state/blue state" with individual social position that Andrew Gelman has written about.

Moving to more general issues, it's often said that Americans accept inequality because we overestimate the chance of upward mobility, as in this article.  I'm not convinced by that--although there's not a lot of evidence, what I've seen suggests that people are have reasonably accurate ideas.  I'll write about the issue more in a subsequent post, but to start with here is a question that Gallup has asked since the 1990s:  "Are you satisfied or dissatisfied with... the opportunity for a poor person in this country to get ahead by working hard?"  The figure shows the percent saying they're satisfied (some asked them if they were very satisfied, somewhat satisfied, somewhat dissatisfied, or very dissatisfied, and for those I combined the first two).